Social Contours & COVID-19
Published Articles:
NEW! COVID-19 vaccine hesitancy and refusal and associated factors in an adult population in Saskatchewan, Canada: Evidence from predictive modelling
Nazeem Muhajarine, Daniel A. Adeyinka, Jessica McCutcheon, Kathryn L. Green, Miles Fahlman, Natalie Kallio
PLOS ONE, Published: November 12, 2021
https://doi.org/10.1371/journal.pone.0259513
![]()
TAKING THE PULSE OF COVID-19 IN SASKATCHEWAN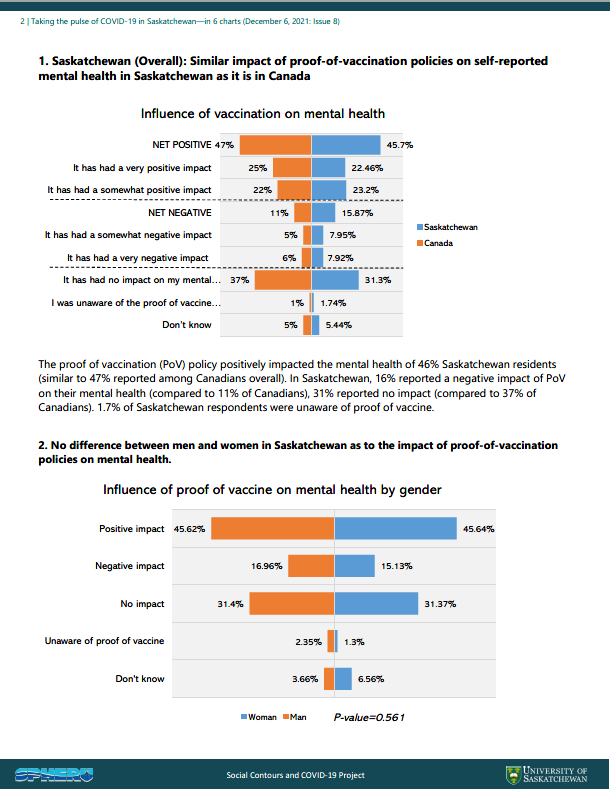
Issue 8: Taking the Pulse of COVID-19 in Saskatchewan—in 6 charts
Released December 6, 2021
QUESTION: What is the impact of vaccination policies on self-reported mental health of adults in Saskatchewan?
Key Takeaways- Overall, in Saskatchewan adults, the proof-of-vaccination policy has had a positive effect on self-reported mental health of most adults, approximately one in two; however, one in six respondents stated the policy had negative effects on their mental health.
- The impact of proof of vaccine policy on self-reported mental health in Saskatchewan is comparable to the rest of Canada.
- The effect of the policy is does not vary significantly by gender, among equity-seeking groups, and by location of residence.
- Respondents who have been mostly negatively impacted by proof of vaccine policy were younger adults (<55 years), about one in five, and those who declared themselves as unvaccinated.
Previous issues of Taking the Pulse
Issue 7: Taking the Pulse of COVID-19 in Saskatchewan—in 11 sets of charts
Released October 29, 2021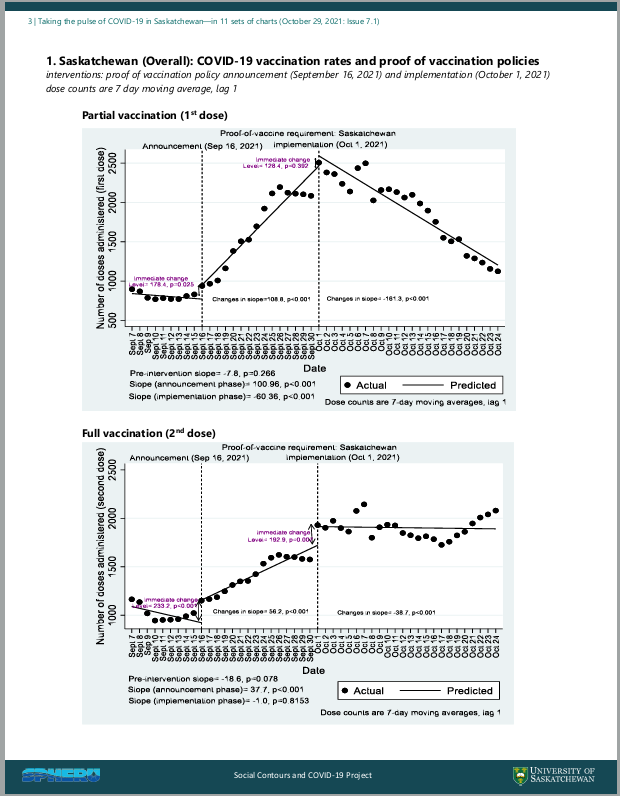
QUESTION: Does proof-of-vaccination policy increase vaccine uptake? If so, by how much? If increased, is it sustained?
- Overall, in Saskatchewan, the proof-of-vaccination policy had a significant effect in doses of vaccines administered, both first and second doses, following the proof of vaccination policy announcement on September 16, 2021. However, the uptake of only second dose vaccines significantly increased following the policy implementation on October 1, 2021.
- Notably, however, the steady increase in uptake of first dose vaccines following announcement of policy appear not to have been sustained in the weeks following the policy implementation. The first dose vaccine uptake having peaked around the date of policy implementation and steadily decreasing in the time following.
- The uptake of second dose vaccine—having reached just under 2000 daily, on average, at the date of policy implementation—have held steady and continued at that pace in the weeks following.
Issue 6: Taking the Pulse of COVID-19 in Saskatchewan—in 4 charts (August 9, 2021): Vaccines and masks in Saskatchewan during the COVID-19 pandemic
This brief focuses on the dual behaviour of mask-wearing and vaccine intention.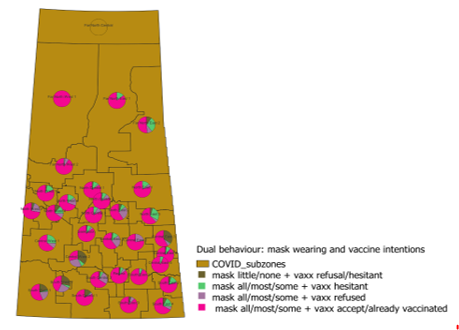
Key Takeaways
- As Saskatchewan reopens with no mask mandates, what does the evidence say about the dual behaviour of mask-wearing and vaccine intent? The Social Contours and COVID-19 research provides the evidence. These results are particularly relevant as we see continuing upticks in case numbers in the province. Those who are hesitating or refusing vaccination and do not wear masks are at heightened risk for continuing to spread the virus and prolong COVID-19 in Saskatchewan. There is a clear relationship between vaccine intent and mask-wearing in the province. Specifically, those who refuse vaccines are, for the most part, the same individuals who do not wear masks in public indoor places.
- Those who engaged in more protective behaviour (e.g., seeing only a few people—less than 5—outside of their household) were more likely to wear masks consistently (defined as wearing ‘all the time,’ ‘most of the time,’ or ‘some of the time’) and accept vaccines versus those masking little/none of the time and reporting vaccine hesitance or refusal.
- Several regions (sub-zones) in the southwest corner of the province, as well as pockets in the southeast, show consistently high rates of masking little/none of the time and reporting vaccine hesitance/refusal. Even among those who mask consistently, these regions display higher vaccine hesitance and refusal rates than the rest of the province.
Issue 5: Taking the Pulse of COVID-19 in Saskatchewan—in 8 maps (August 5, 2021): Vaccine Acceptance, Hesitancy, and Refusal by Sub-Zones
In this brief, notable findings from an analysis of before and after Saskatchewan began its COVID-19 vaccination campaign are reported.
- PART 1: In which areas (sub-zones) in Saskatchewan do we see COVID-19 vaccine acceptance or hesitancy or refusal since the vaccine campaign began compared to before?
- PART 2: What factors at an area-level (sub-zones) are associated with COVID-19 vaccine acceptance or hesitancy or refusal since the vaccine campaign began in Saskatchewan?
Data are based on Social Contours and COVID-19 study, as of June 7th, 2021; this includes 10,627 respondents to date (unless otherwise indicated). Results are weighted by age, gender, and location of residence (Census 2016, Saskatchewan adult population).
Issue 4: Taking the Pulse of COVID-19 in Saskatchewan—in 5 charts (Released 08-Jun-2021)
—data collected May 4, 2020 to May 2, 2021
Data in this issue of Taking the Pulse are based on Social Contours and COVID-19 study; as of June 7, 2021; this includes 10,627 all respondents to date (unless otherwise indicated). Results are age-gender-location of residence weighted (Census 2016, Saskatchewan adult population) and data are 4-week moving averages when time trends are presented. In this brief, some notable findings in the latest iteration of the Social Contours and COVID-19 study are reported (April 2021, n=1,280)
Download:
Key Takeaways
With Saskatchewan’s roadmap to reopening proceeding, what does the evidence say about the dual behaviour of mask-wearing and vaccine receipt? Social Contours and COVID-19 research provides the evidence.
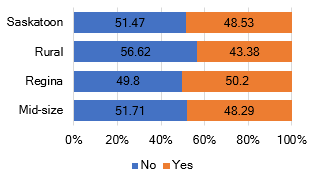
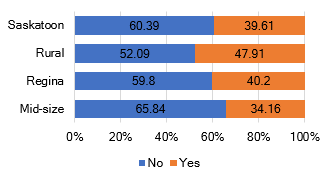
- Several regions (subzones) in the southwest corner of the province and pockets in southeast and northeast show consistently low mask-wearing/social distancing and low vaccine acceptance rates. The opposite is true for Regina, Saskatoon, and the northwest—these regions show high mask-wearing and high vaccine acceptance.
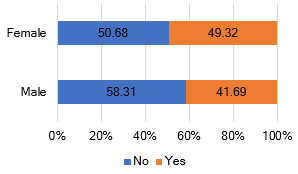
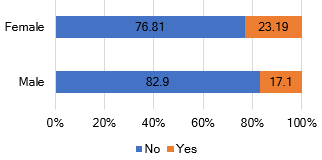
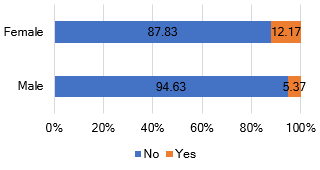
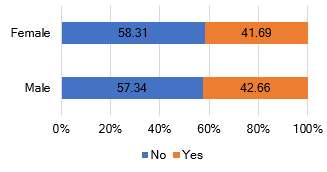
- Men and women who practiced consistent mask-wearing had similar rates of vaccine acceptance. However, among men who reported scarcely practicing mask-wearing, 55% said they will refuse vaccine, whereas among women in that category, 39% said so. Among men who reported not wearing masks, 65% will not get a vaccine or were hesitant, compared to 47% of women who said they will not get vaccine or were hesitant.
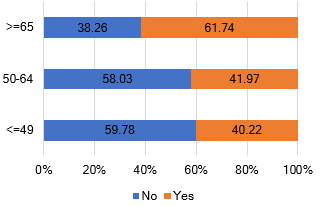
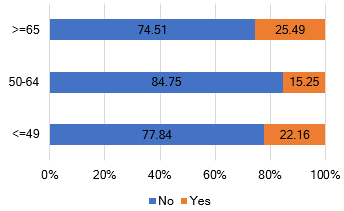
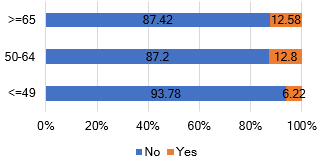
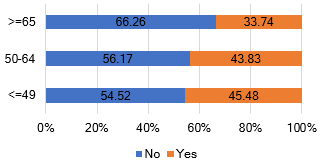
- Older respondents, 65 and over, said they wore masks consistently and had the highest vaccine acceptance rate (86%), compared to 78% for those between 50 and 64 and 79% 49 years and younger.
- Among younger respondents, those who reported scarcely wearing masks also reported the highest vaccine refusal rate (53% for 49 and younger vs 37% for those 50-64 and 33% for 65 and older).
_____________
Issue 3: Taking the Pulse of COVID-19 in Saskatchewan—in 9 charts (Released May 28, 2021)
—data collected May 4, 2020 to May 2, 2021
Data in this issue of Taking the Pulse are based on Social Contours and COVID-19 study; as of May 2, 2021; this includes 10,627 all respondents to date (unless otherwise indicated). Results are age-gender-location of residence weighted (Census 2016, Saskatchewan adult population) and data are 4-week moving averages when time trends are presented. In this brief, some notable findings in the latest iteration of the Social Contours and COVID-19 study are reported (April 2021, n=1,280)
Download:
Perceptions on response to COVID-19 in Saskatchewan
In Round 10, April 2021, of the Social Contours and COVID-19 survey, we asked respondents about their vaccine intentions, perceptions on the vaccine roll-out and government countermeasures, and their most recent behaviour. In addition, we asked why Saskatchewan’s COVID-19 metrics (case rates, hospitalizations, deaths) were the way they were and asked respondents for feedback on issues such as lockdown fatigue, government performance, public health order clarity, and general observance of public health orders. In this brief, we report some key findings.
Key takeaways
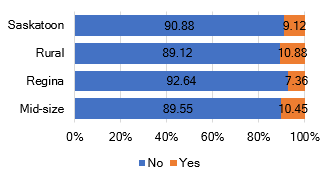
- By early May 2021, 84.4% of respondents indicated that they were prepared to get a vaccine when eligible, while 4.5% were vaccine hesitant and 11.2% said they would refuse. When respondents were asked to indicate why they were vaccine hesitant, concerns over safety and a wish for more scientific evidence were the most common responses. Similarly, vaccine refusal was most highly attributed to insufficient amount of testing and concerns over safety.
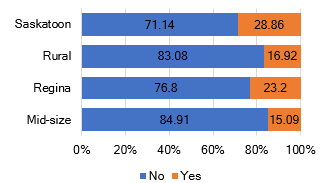
- Vaccine acceptance was higher in females compared to males, those above the age of 64 and among respondents living in either Saskatoon or Regina compared to those in mid-sized towns or rural Saskatchewan.
- After new COVID-19 variants (83%), 79% of respondents indicated that the second most concerning matter was the continuing third wave of the pandemic. When rating the government’s performance in getting people vaccinated with similar sentiment about the federal government, 53% of respondents felt the provincial government had done a good or very good job compared to 30% for the federal government.
- When asked why cases and deaths continue as they are in Saskatchewan, respondents commonly attributed the lockdown fatigue (45%) and not enough people following public health orders (46%); however, 59% of respondents believe that public health restrictions don’t go far enough.
- Women, those above the age of 64, and respondents from Saskatoon or Regina indicated that public health restrictions did not go far enough. Meanwhile, men, those younger than 49, and respondents from mid-size towns or rural Saskatchewan were more likely to indicate that they were tired of restrictions.
_____
Issue 2: Taking the Pulse of COVID-19 in Saskatchewan--in 10 charts (Released April 23, 2021)
—data collected May 4, 2020 to April 3, 2021
Data in the downloadable brief, "Taking the pulse of COVID-19 in Saskatchewan—in 10 charts" (below), are based on Social Contours and COVID-19 study; as of April 3, 2021, this includes n=9,347 (unless otherwise indicated). Results are age-gender-location of residence weighted (Census 2016, Saskatchewan adult population) and data are 4-week moving averages when time trends are presented.
Download:
____
ROUND 8: Released March 22, 2021
—data collected May 4, 2020 to April 3, 2021
Data below are based on Social Contours and COVID-19 study, Round 8 (February 2021), n=1,099. Results are age-gender-location of residence weighted (Census 2016, Saskatchewan adult population). The map on page 4 is based on all 8 rounds of data, as of March 2, 2021, this includes n=8,790.
Key Takeaways
Perceptions on response to COVID-19 in Saskatchewan
In Round 8, February 2021, of the Social Contours and COVID-19 survey, we asked respondents why Saskatchewan’s COVID-19 metrics (case rates, hospitalizations, deaths) were the way they were and asked them to choose among response options (e.g. not enough people follow public health orders; people are tired of restrictions, i.e. “lockdown fatigue”; government has not done enough; public health orders have not been enforced; people are confused about public health orders).
Key takeaways
- The two responses most commonly given were: not enough people follow public health orders (46%) and people are tired of restrictions (42%), followed by 21% who said public health orders have not been enforced and 10% people are confused about public health orders.
- Respondents 65 and older indicate, consistently, that not enough people follow public health orders or people were confused about public health orders. However, younger respondents, below 50, are likely to indicate people are tired of restrictions; this younger set, similar to older, are also likely to say public health orders have not been enforced.
- Women more than men chose the options not enough people follow public health orders, the orders were not enforced, or people were confused about the orders. Similar proportions of women and men indicated people were tired of restrictions.
- Where people lived mattered greatly with respect to which answers that they gave. Respondents from Regina and Saskatoon are more likely to indicate public health orders have not been enforced compared to respondents from rural or mid-size cities/towns. Respondents from Regina, Saskatoon, or mid-size cities/towns are more likely to say not enough people follow public health orders compared to rural respondents. Respondents from rural Saskatchewan were the most likely to say people are tired of restrictions, followed by those in Saskatoon and Regina, and then those who live in mid-size cities/towns.
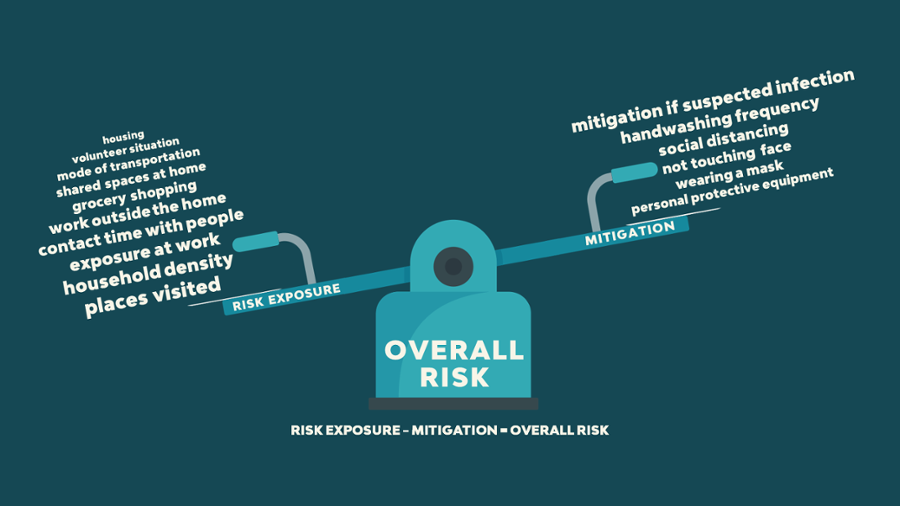
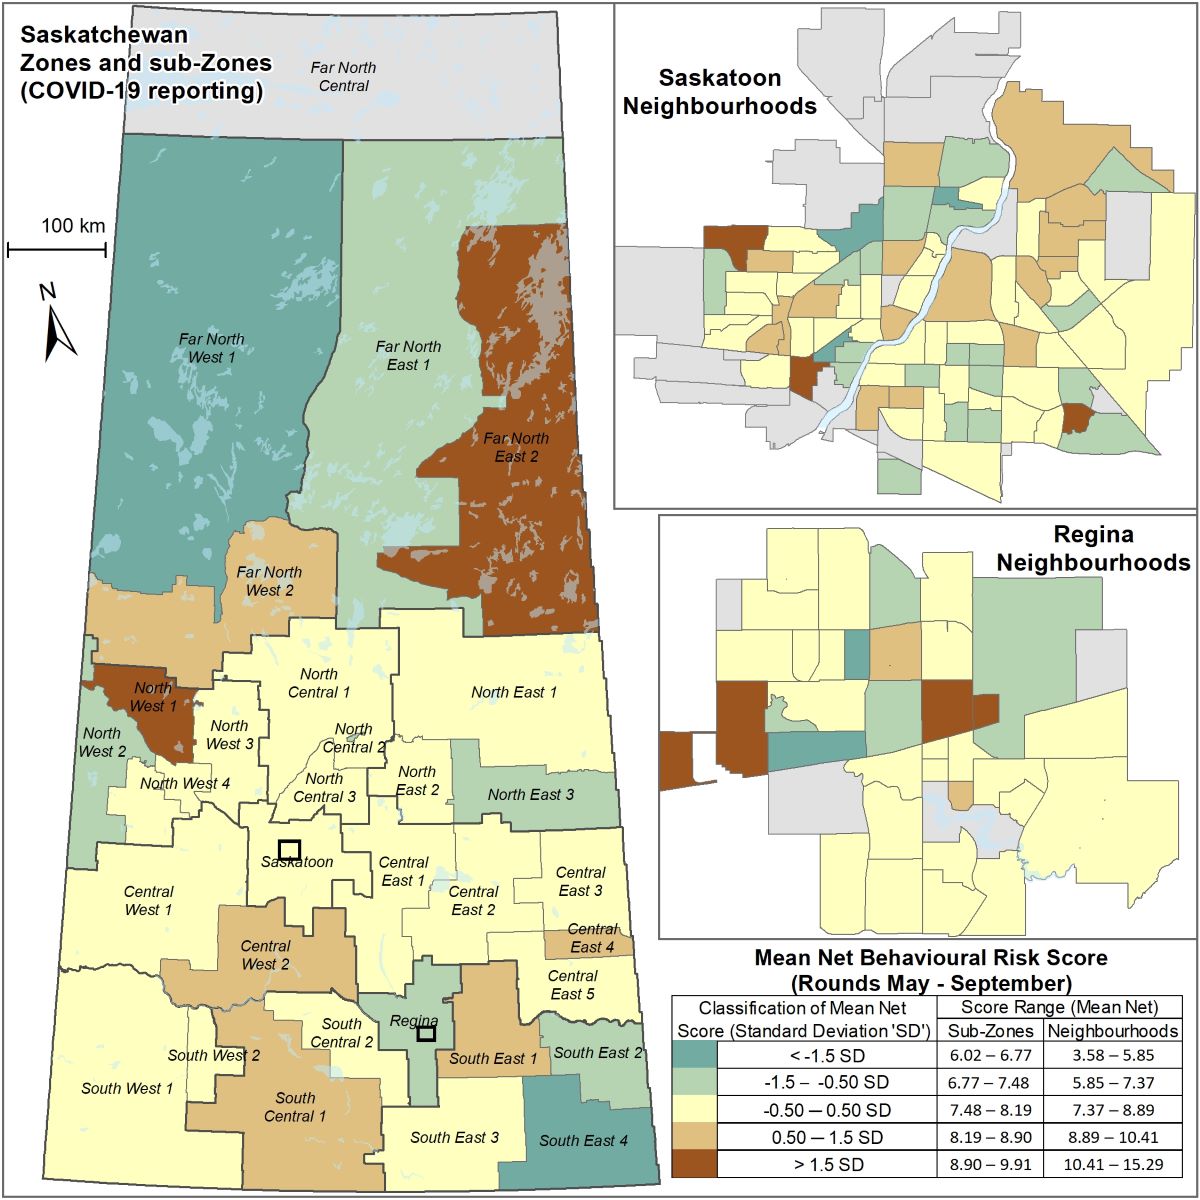
- The map shows Saskatchewan COVID reporting zones and subzones coloured according to a net behavioural risk score, low to high risk, derived from Social Contours survey data. For Regina and Saskatoon, neighbourhood-level risk levels are shown. Ten subzones are deemed at moderately high risk. Ten neighbourhoods in Regina and 18 neighbourhoods in Saskatoon are deemed moderately-high or high risk based on Social Contours data (10 risk exposure variables and 6 risk mitigation variables[i]).
[i] Risk exposure variables: places visited, household density, exposure at work, contact time with people, work outside the home, grocery shopping, shared spaces at home, mode of transportation, volunteer situation, housing. Risk mitigation variables: mitigation if suspected infection, handwashing frequency, social distancing, not touching face, wearing a mask, personal protective equipment.

Data below are based on Social Contours and COVID-19 study; as of March 2, 2021, this includes n=8,790 (where otherwise indicated), results are age-gender-location of residence weighted (Census 2016, Saskatchewan adult population) and data are 4-week moving averages when time trends are presented.
Visiting friend's house, last 7 days (weighted and 4-week moving averages)
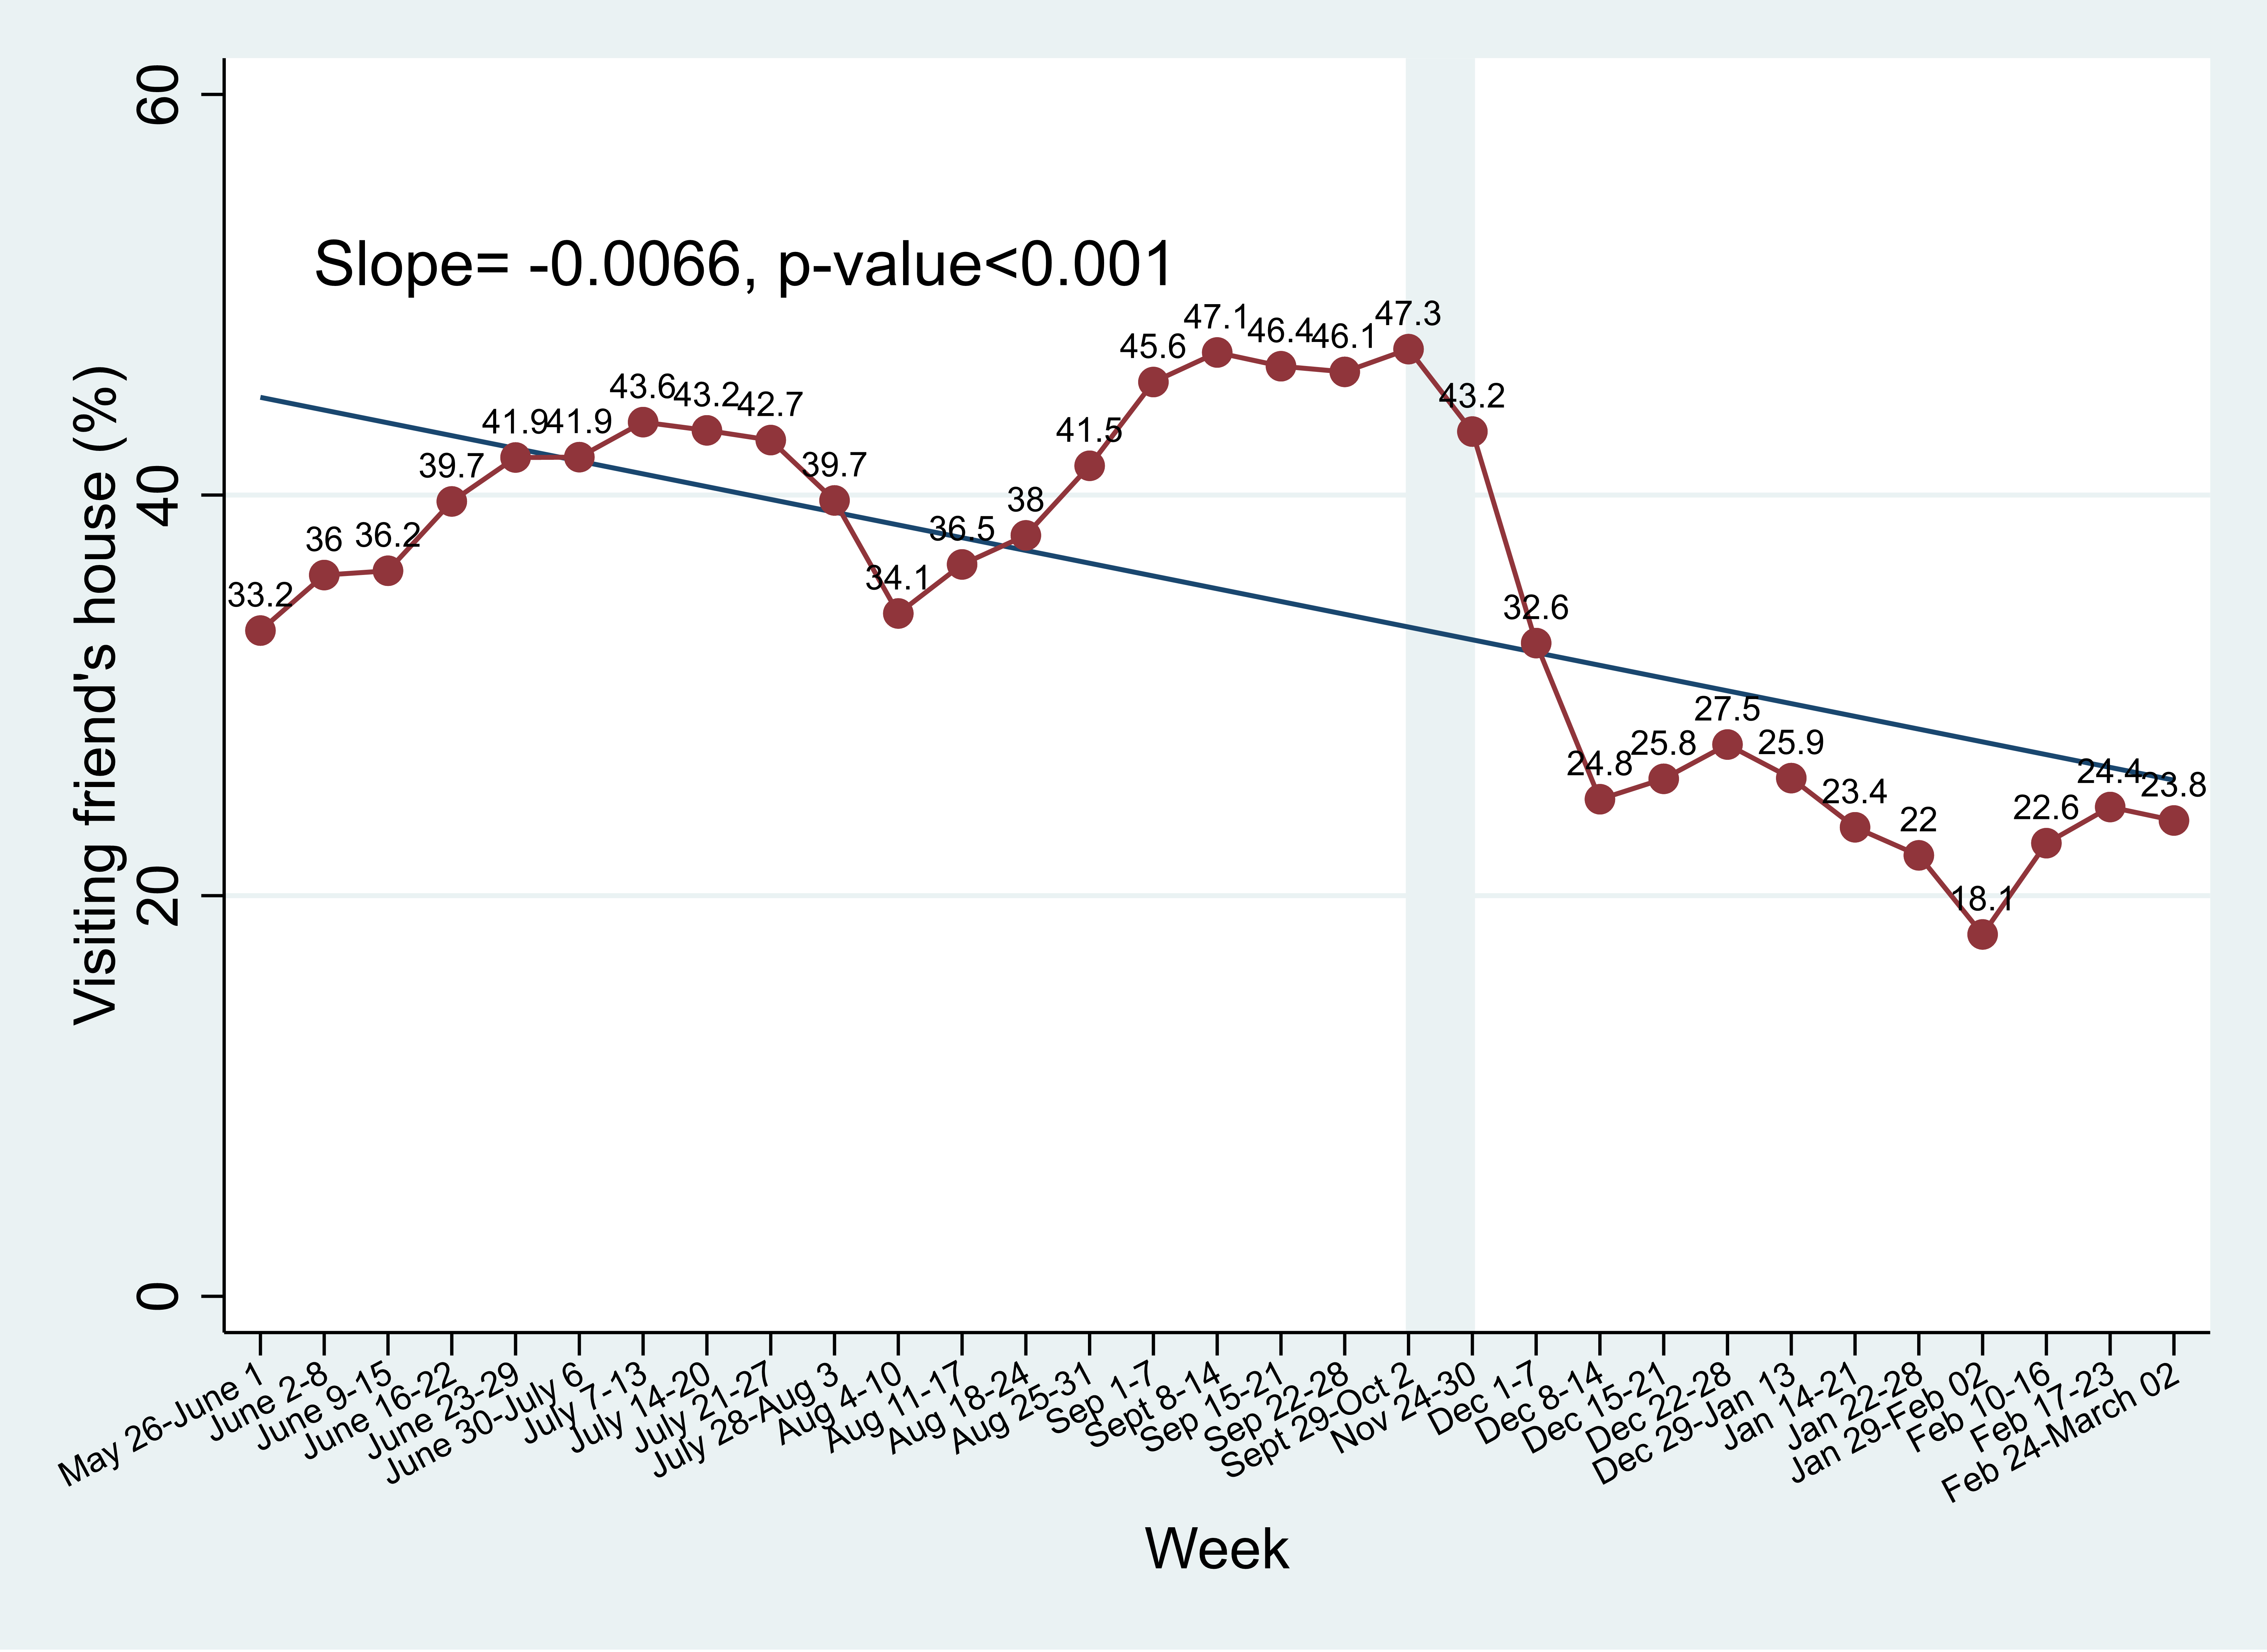
This trend chart shows that in the week leading up to March 2, more than one in 5 respondents indicated that they had visited other households indoors, in the last 7 days.
Visits to restaurant or bar/pub/nightclub, last 7 days
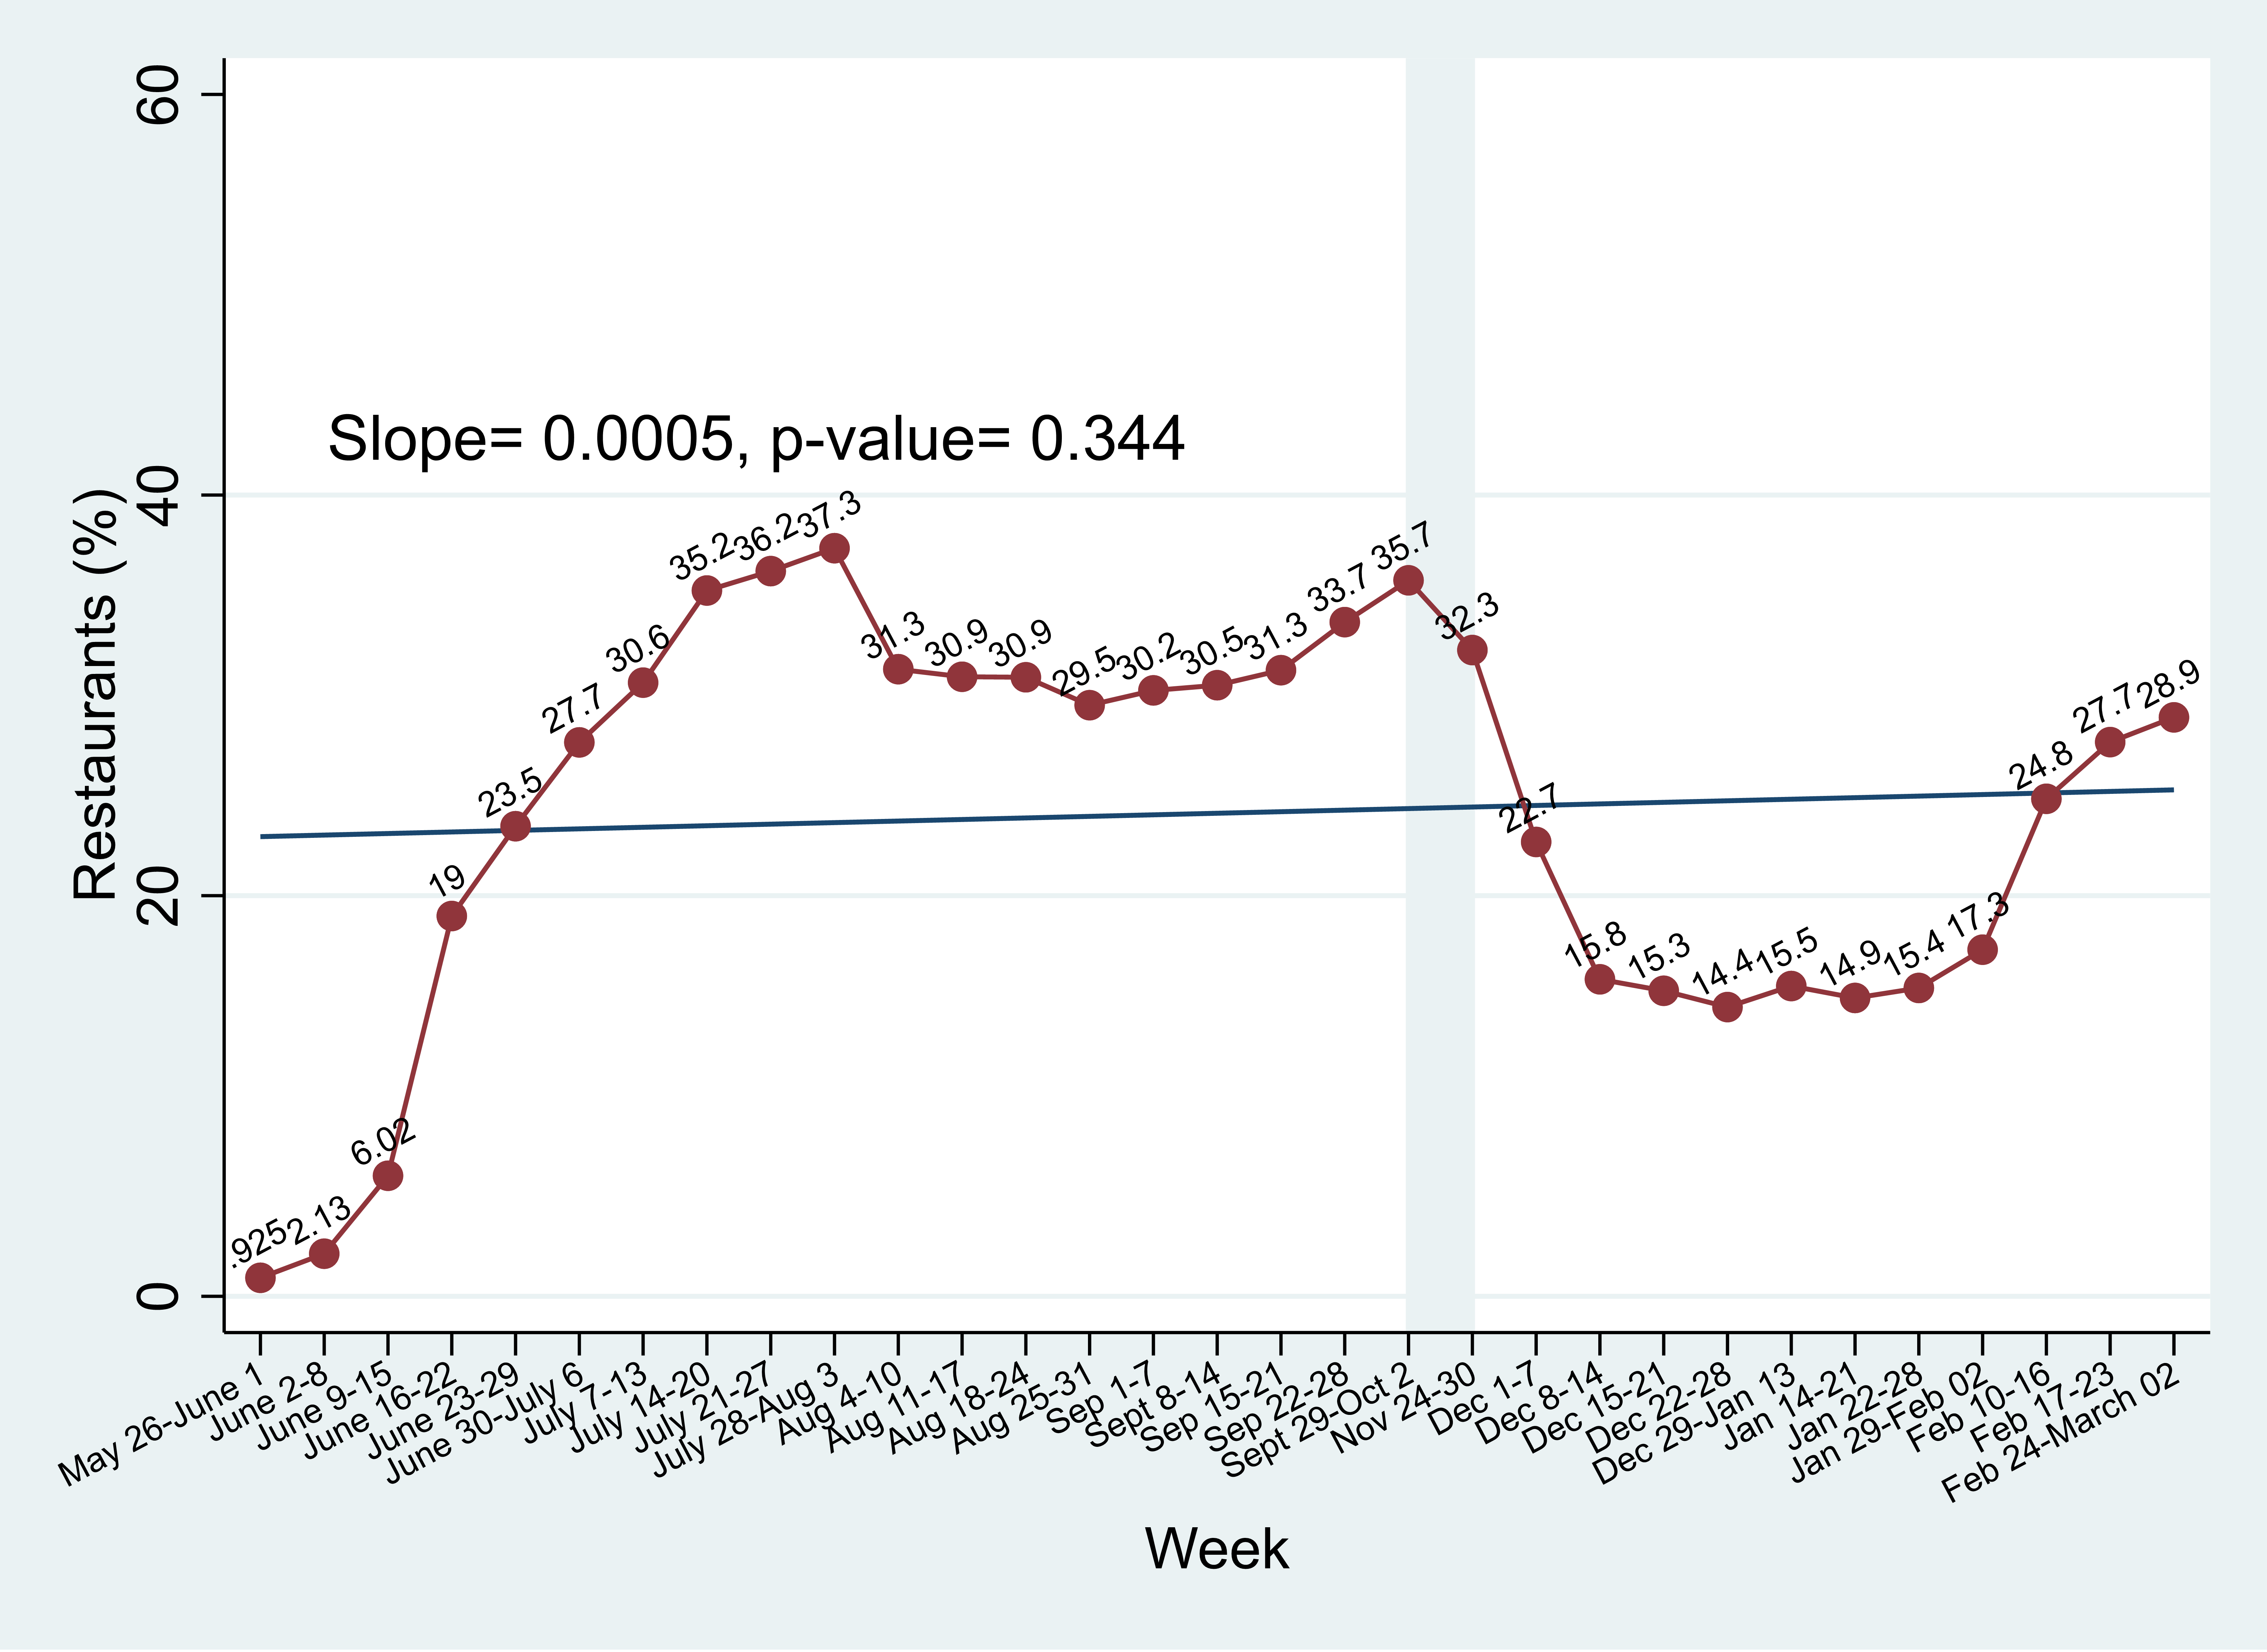
This chart shows in the weeks leading up to March 2, more than one in four (more than 25%) respondents had visited a restaurant or bar in the last 7 days. This is an increase from the previously observed 15% who visited restaurant and bars, throughout the month of December and January.
Percentage who reported that they have visited a place to receive personal or health care services in the last 7 days
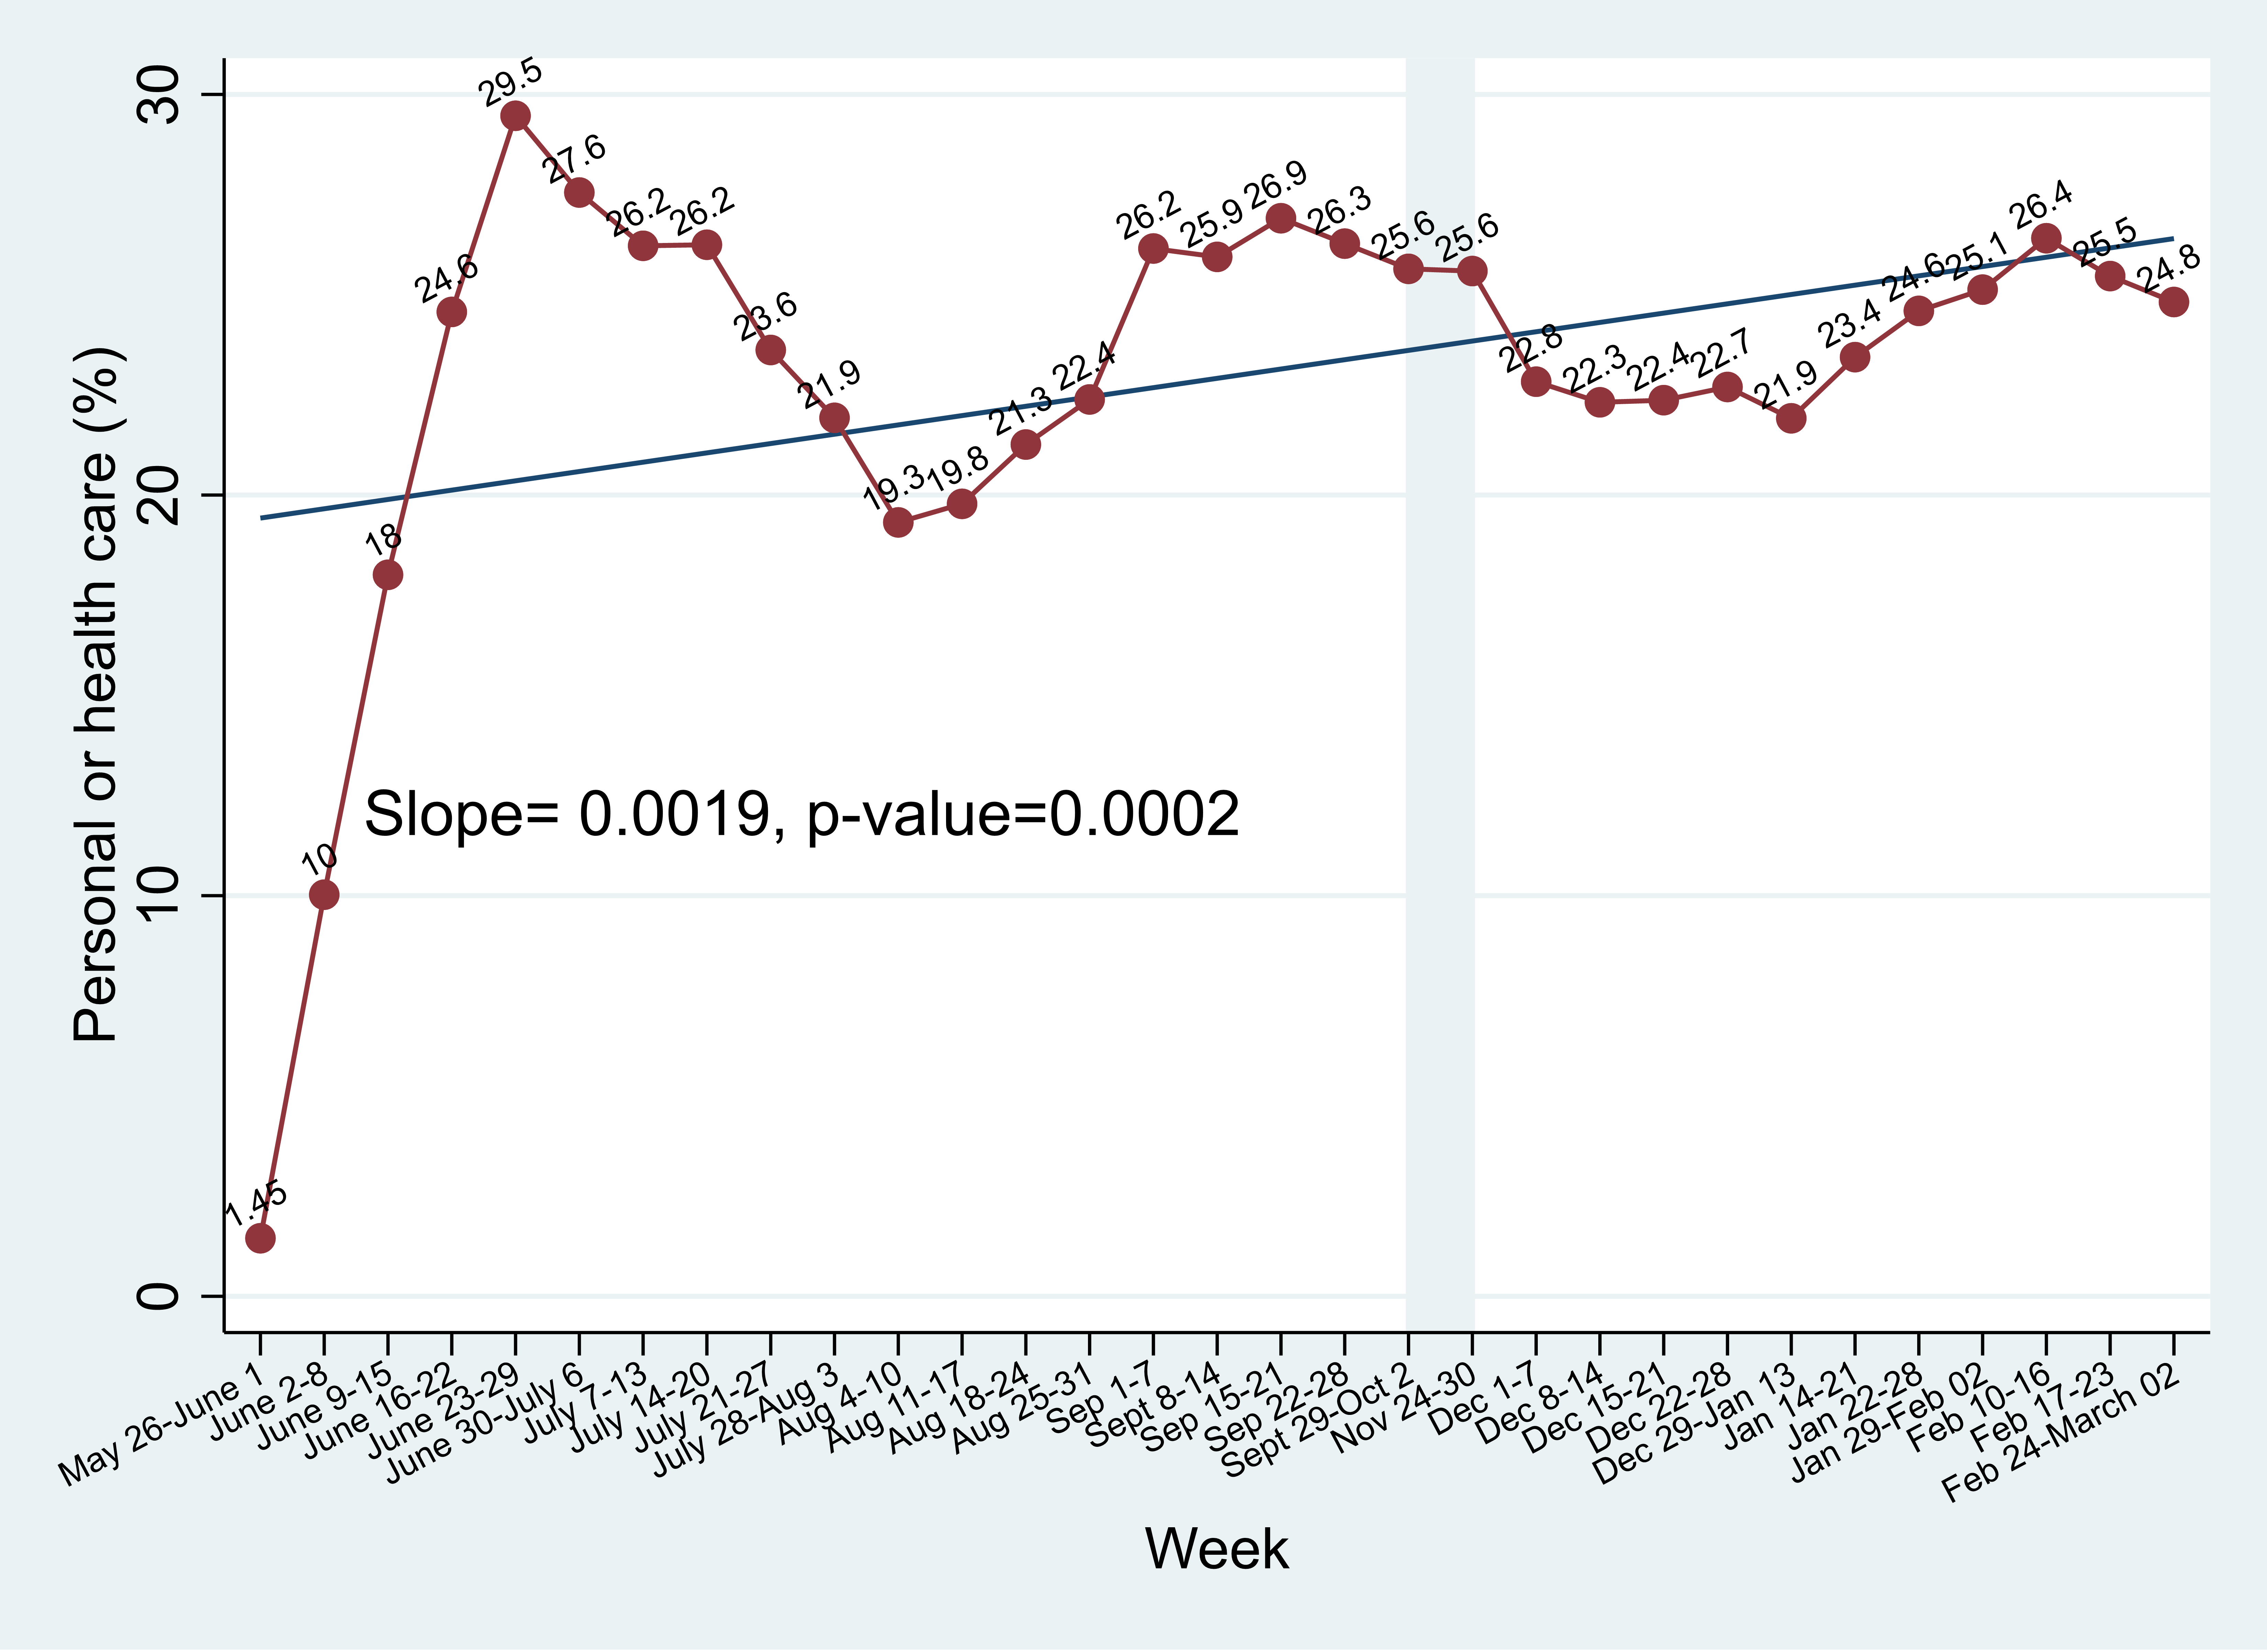
This chart shows about 1 in 5 respondents indicated that they have visited a place where they had received personal or health care services in weeks leading up to March 2.
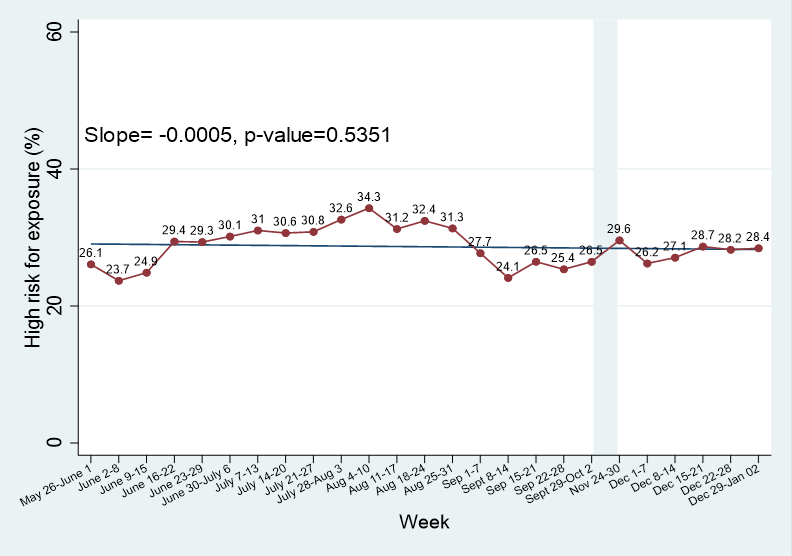
Contact intensity (number of people seen X for how long), last 7 days.
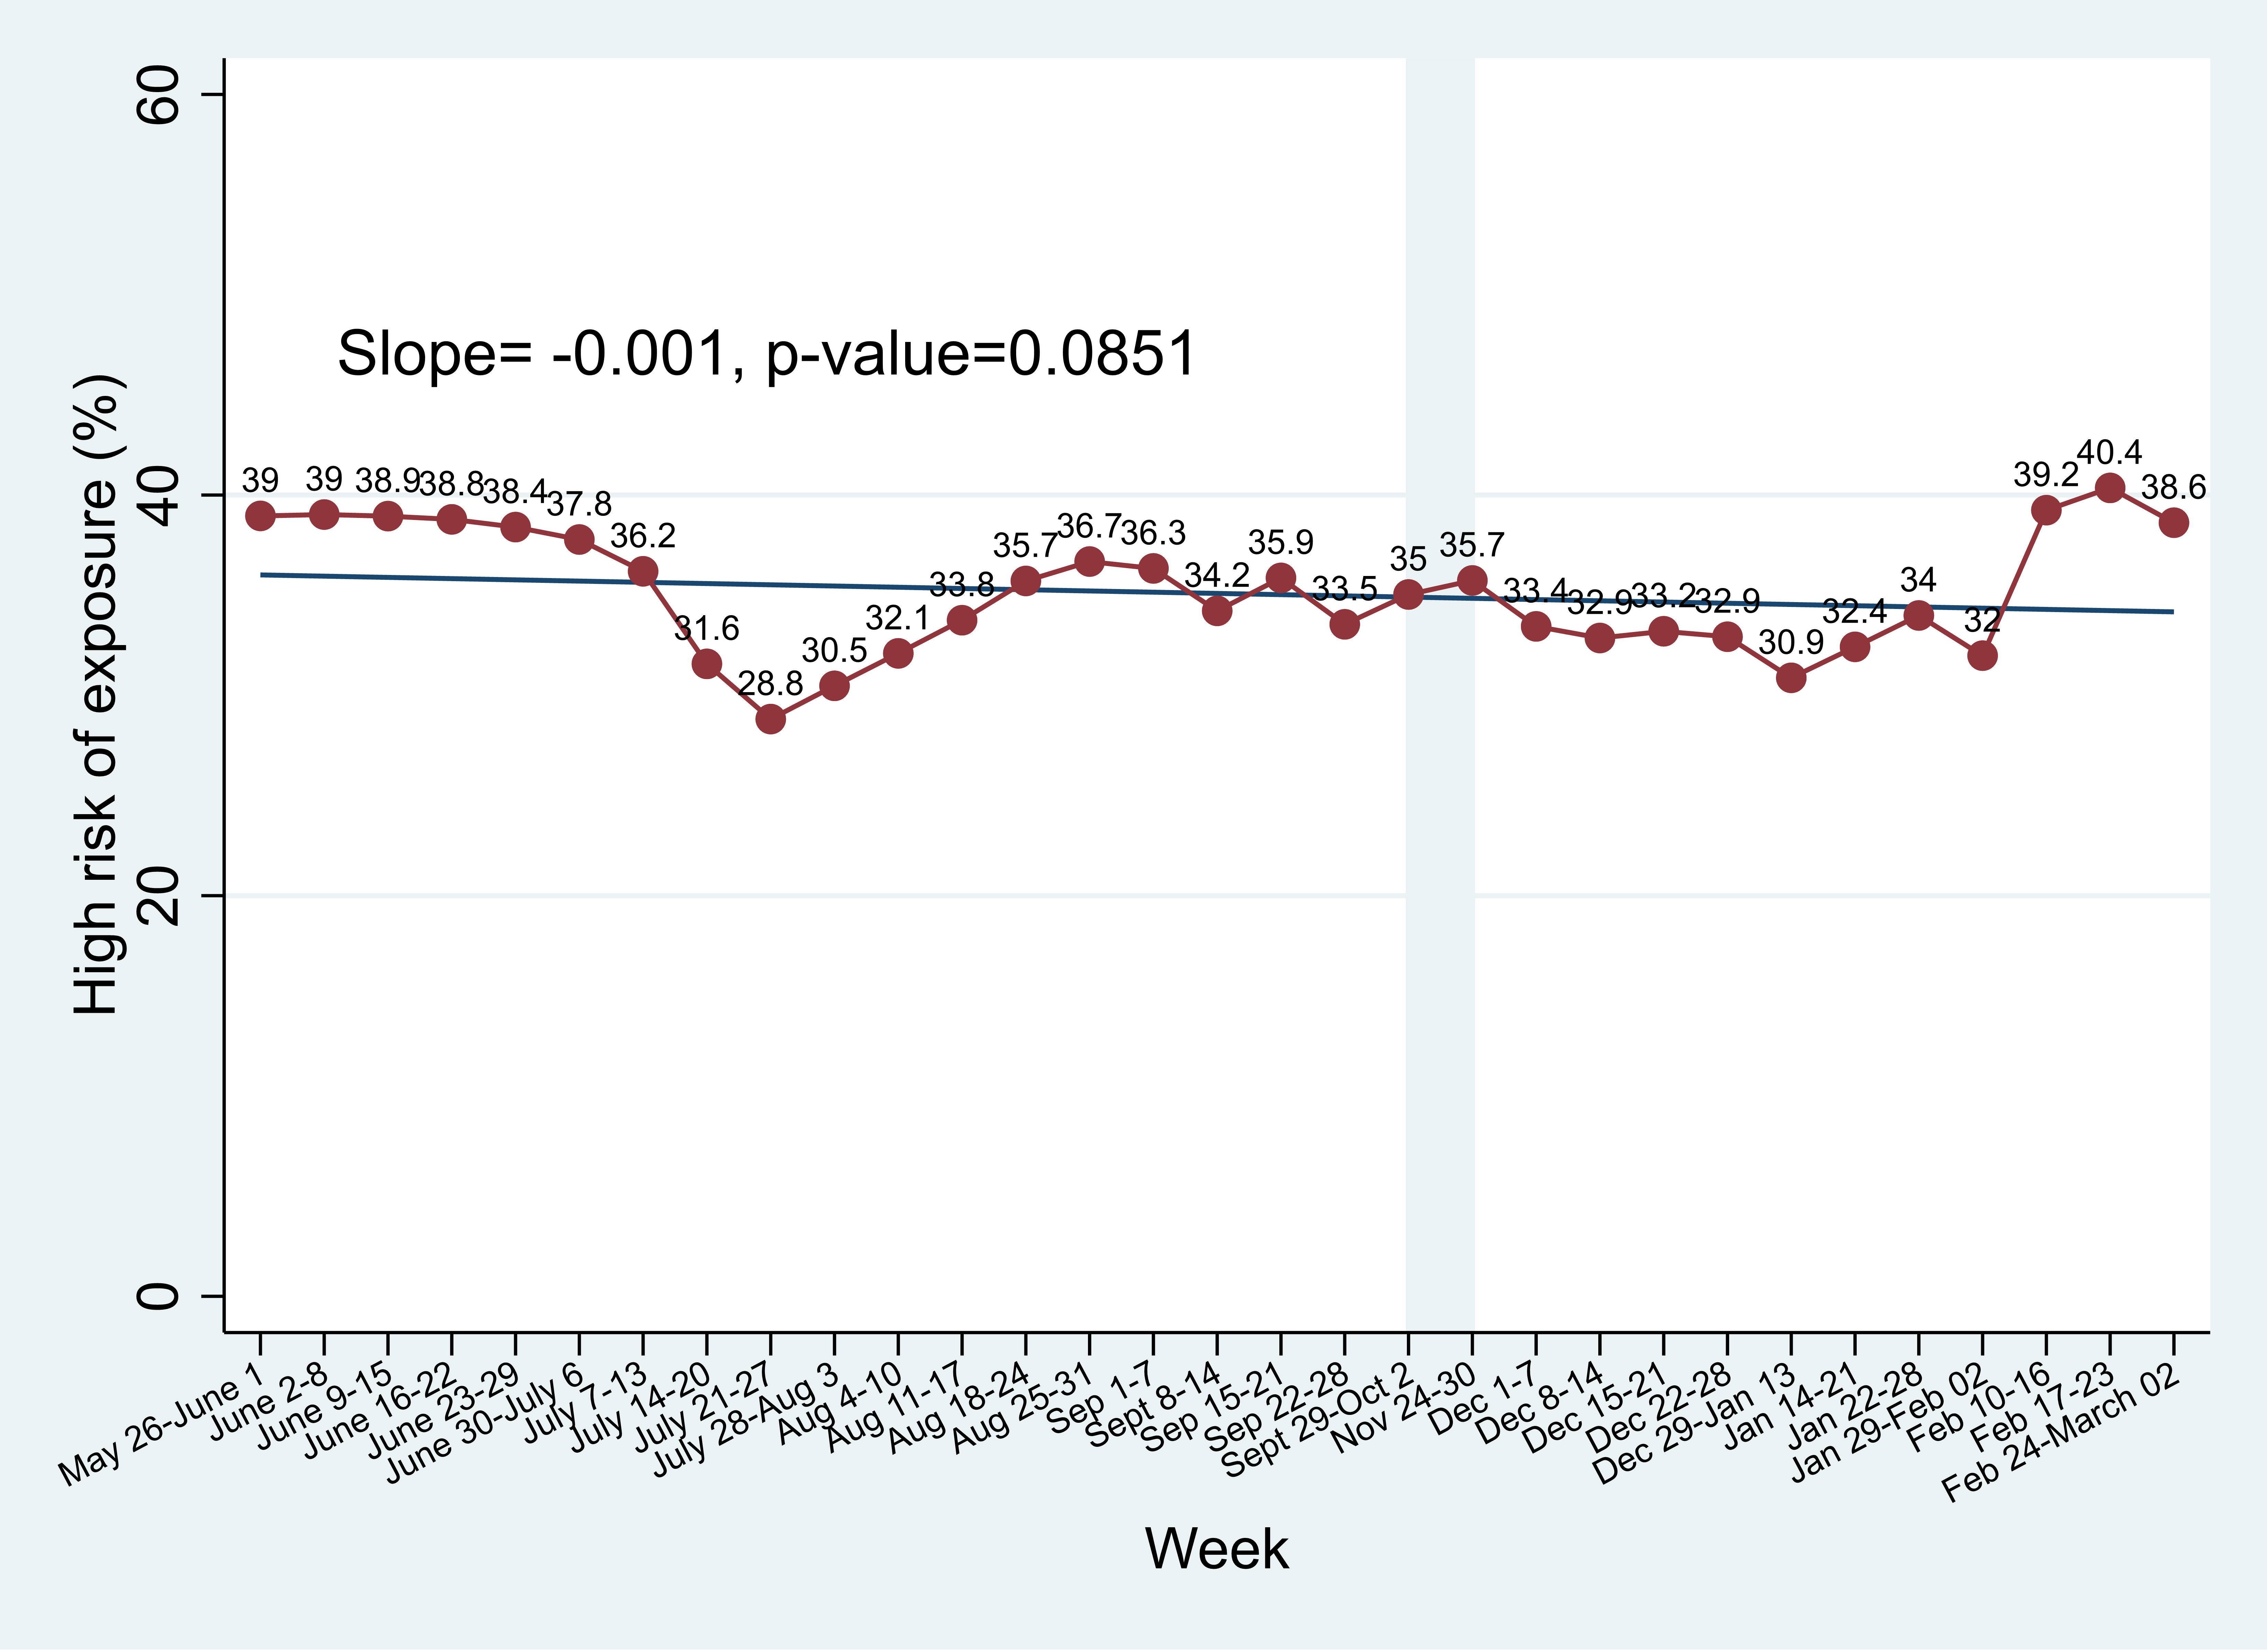
This chart shows percentage of those deemed high risk for exposure due to contact intensity with people outside your household in the last 7 days. Over the months, the trend line has held steady around 35%. In February, the high-risk percentage shows a noticeable jump to around 40%.
Contact intensity by age
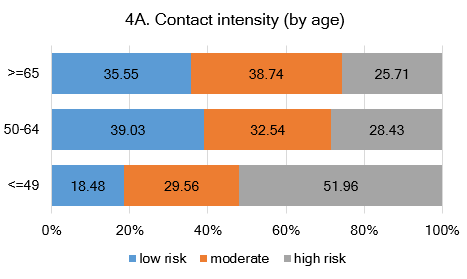
Respondents younger than 50, compared to those who are older than 65 years are twice as likely to report high contact intensity (more people seen for longer duration) in the last 7 days in the month of February 2021.
Percentage who reported their risk exposure at work was ‘high’
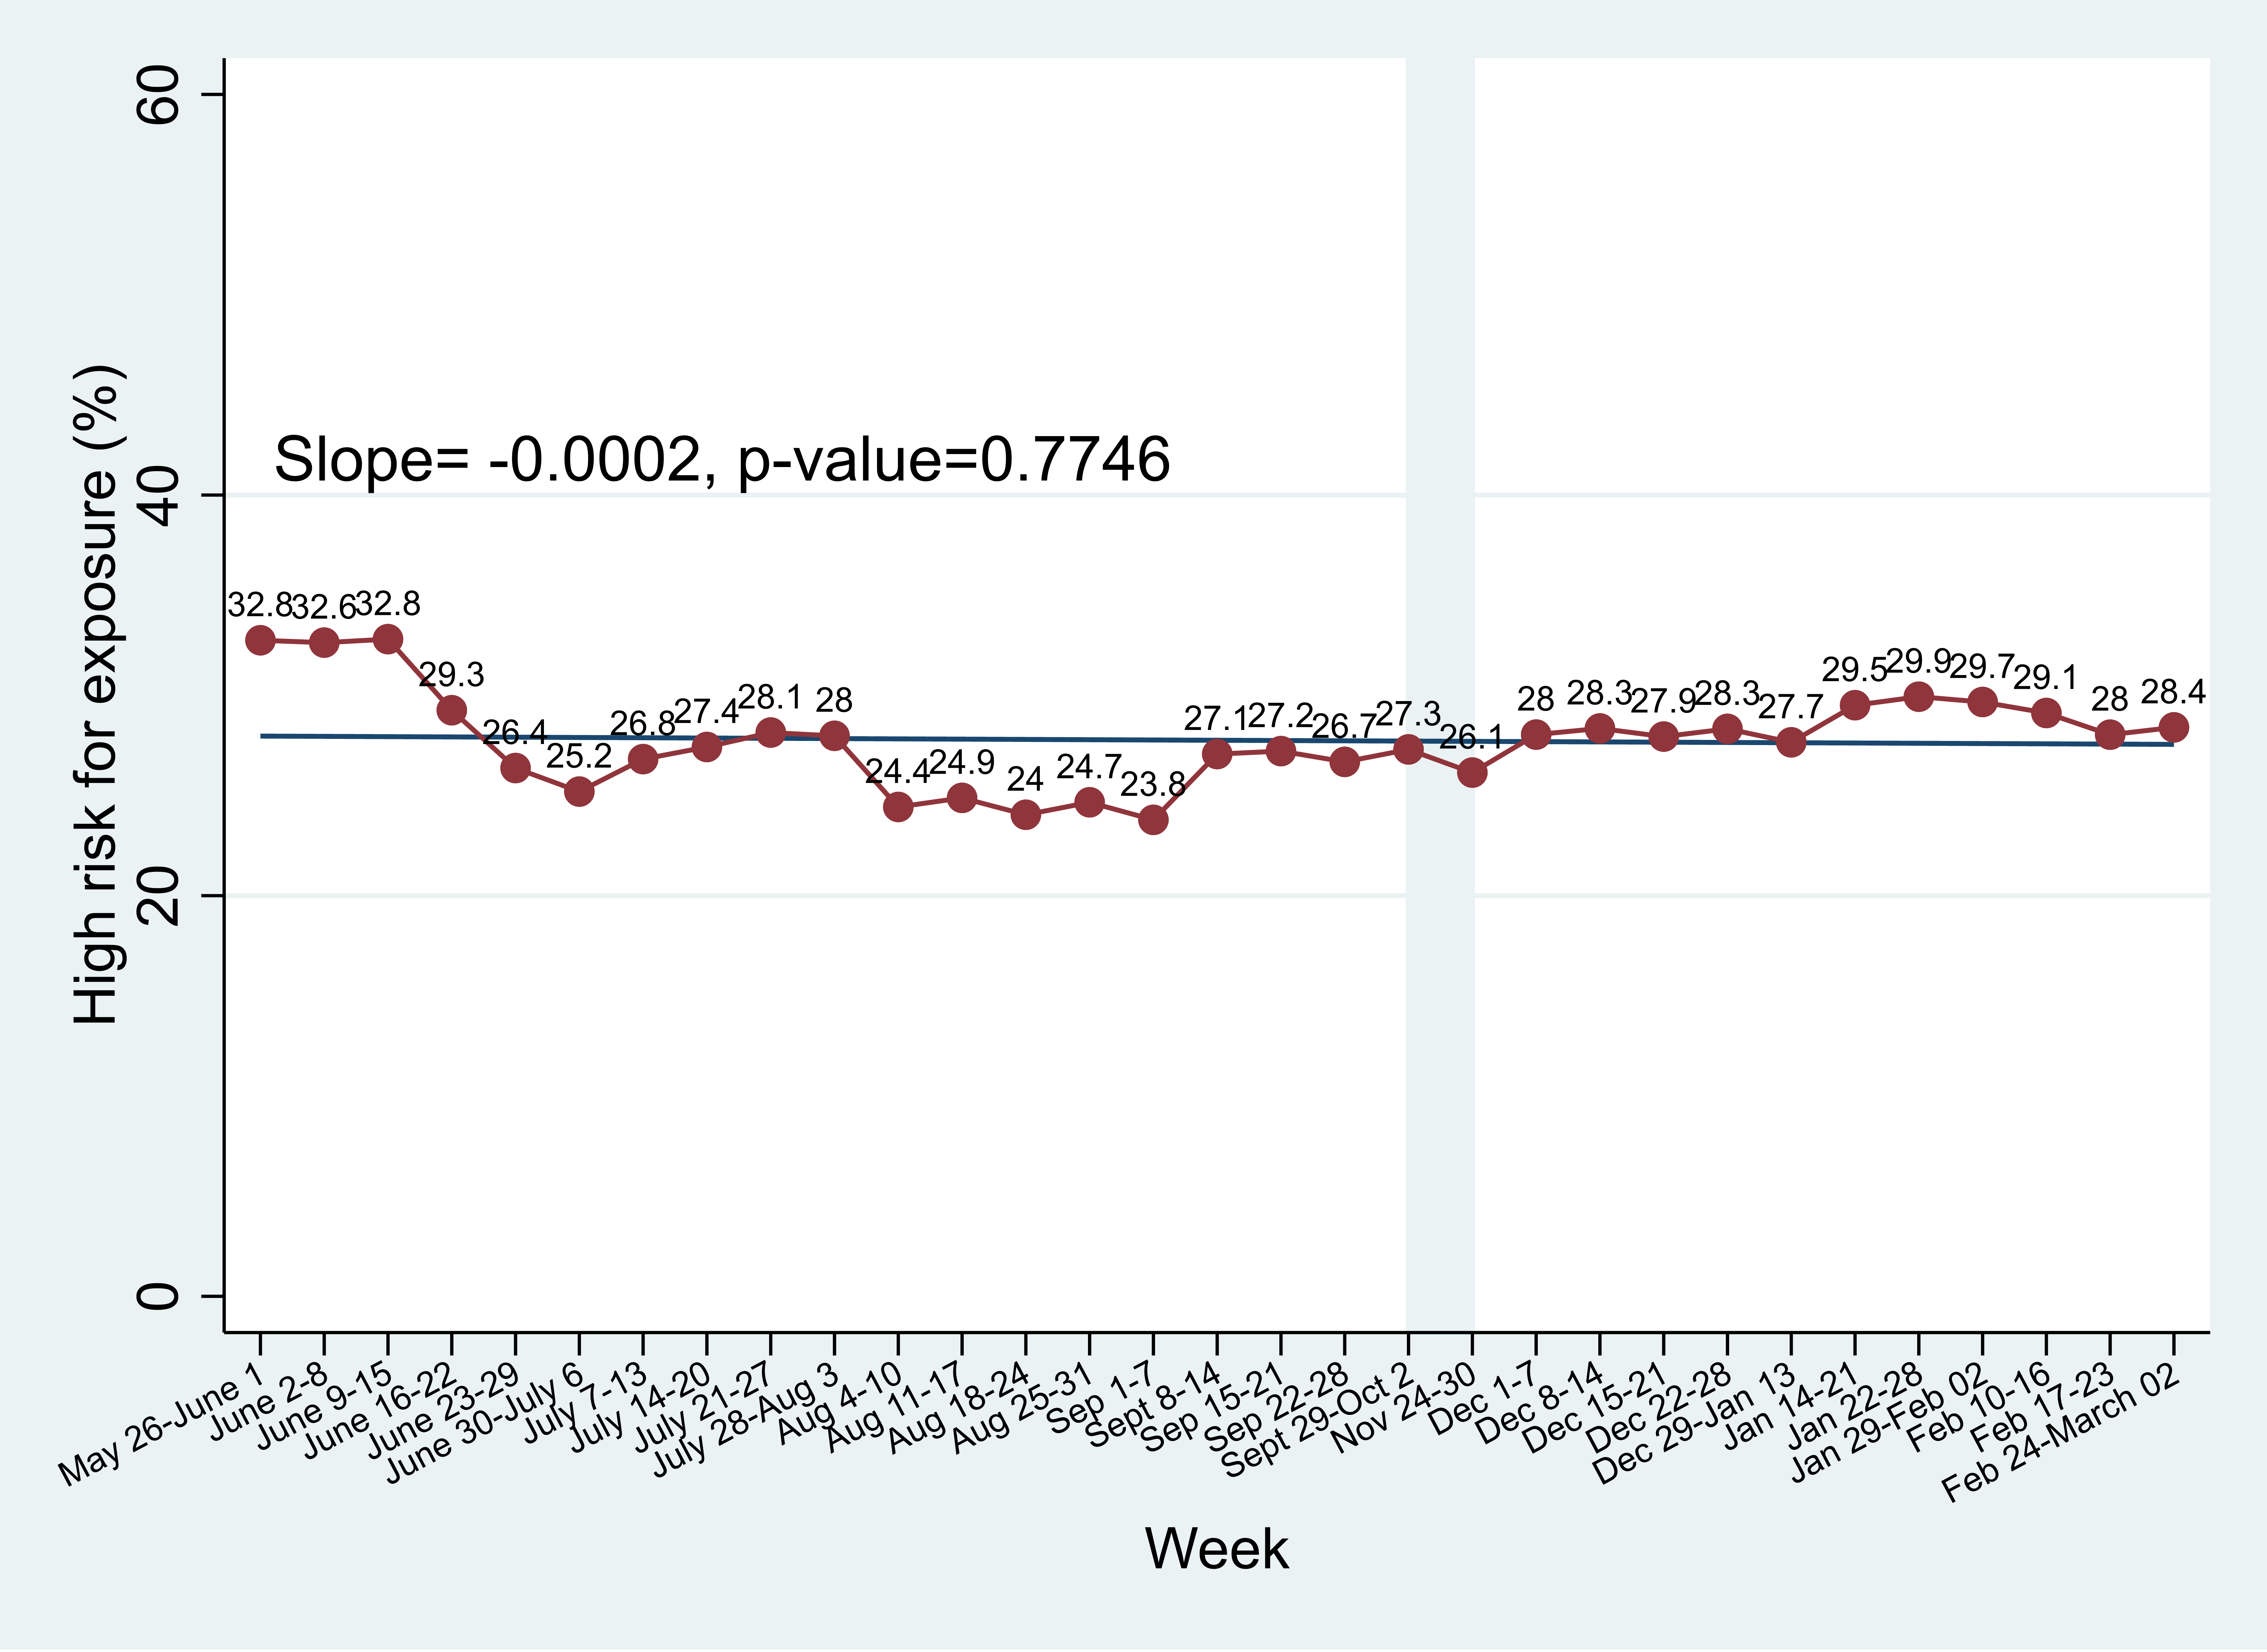
This graph shows those who self-reported their chances of being exposed to the virus at workplace as ‘high’. This percentage has held steady since last December.
_______
Data based on Social Contours and COVID-19 longitudinal panel study; as of Jan 2, 2021 n=7015, age-gender-location of residence weighted (Census 2016) and data are 4-week moving averages.
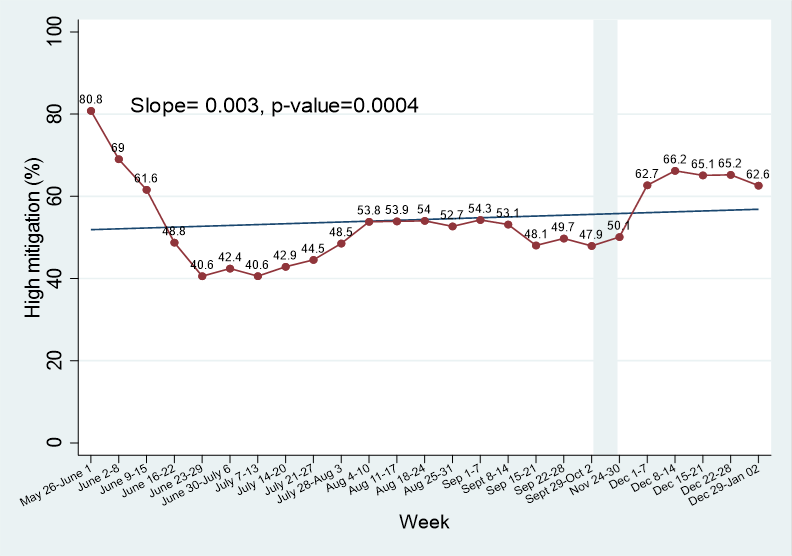
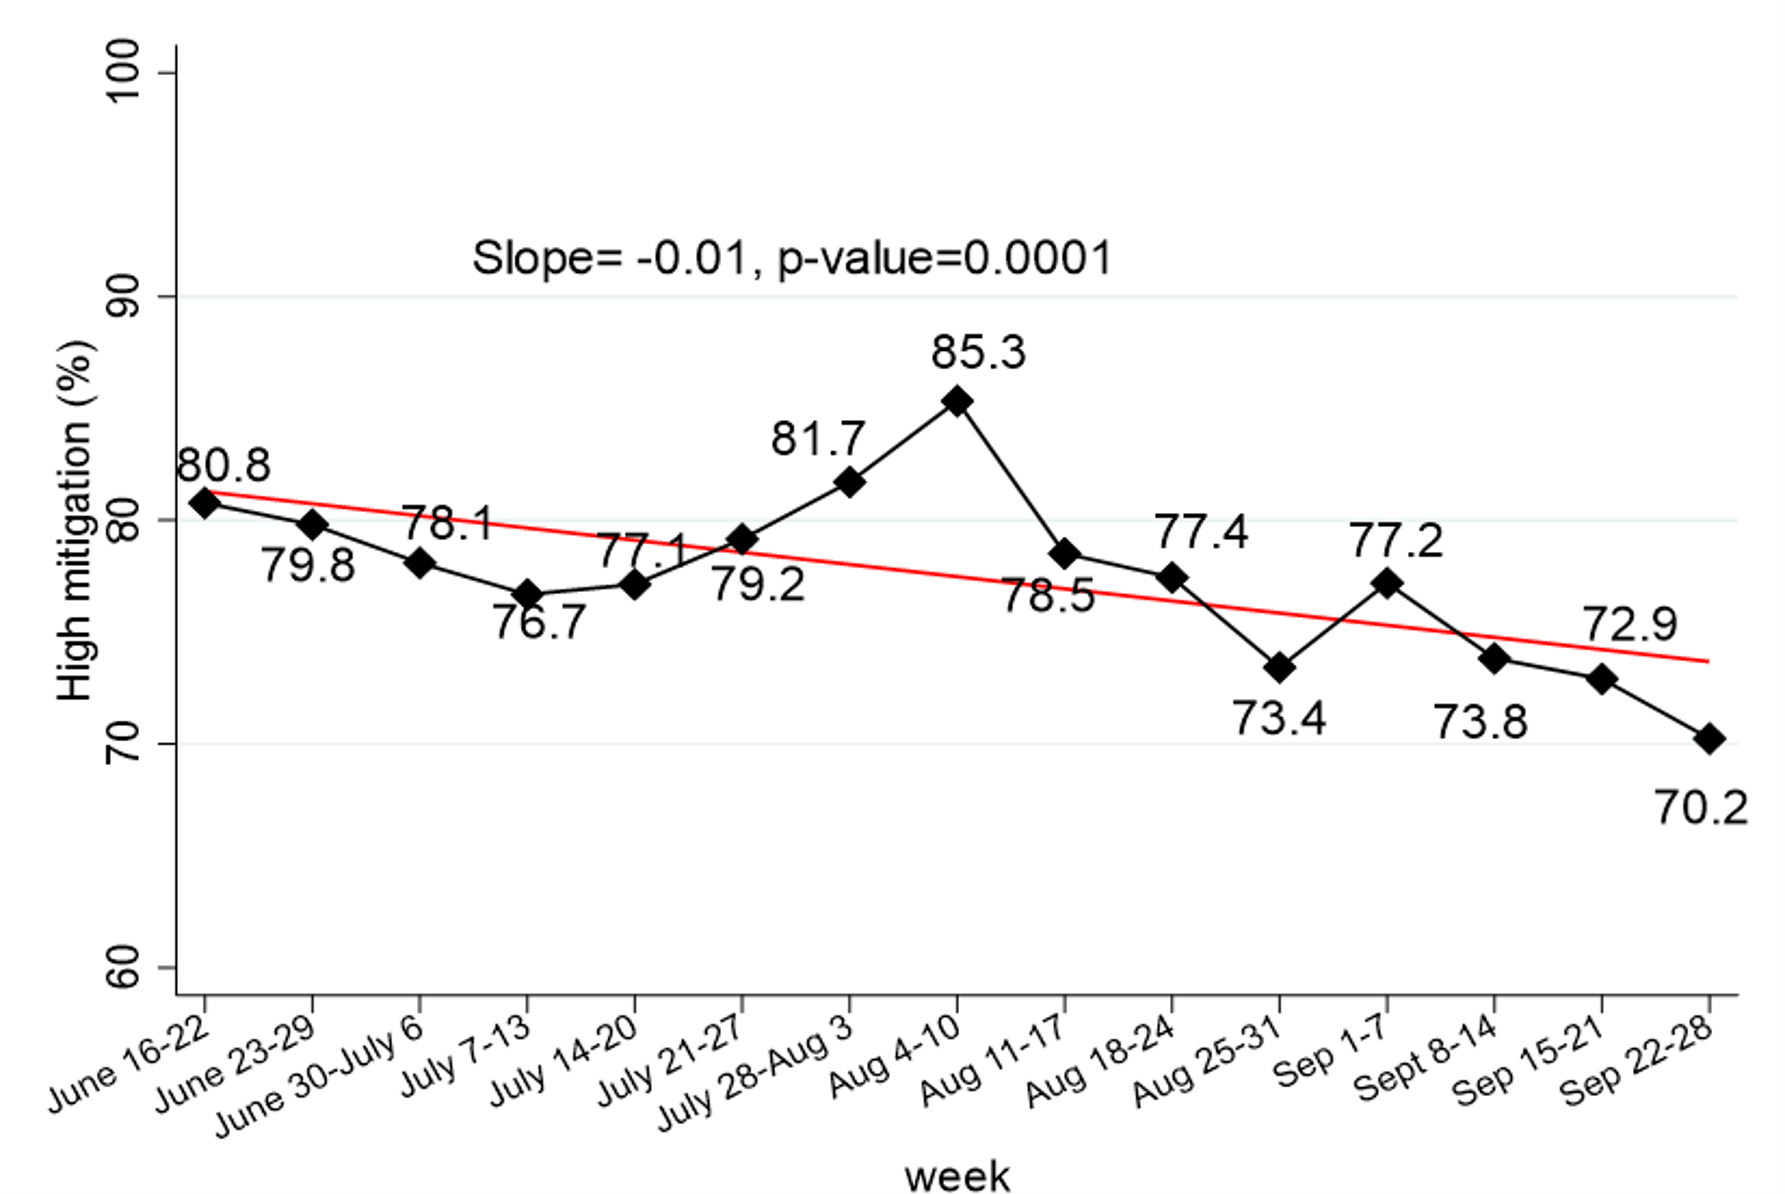
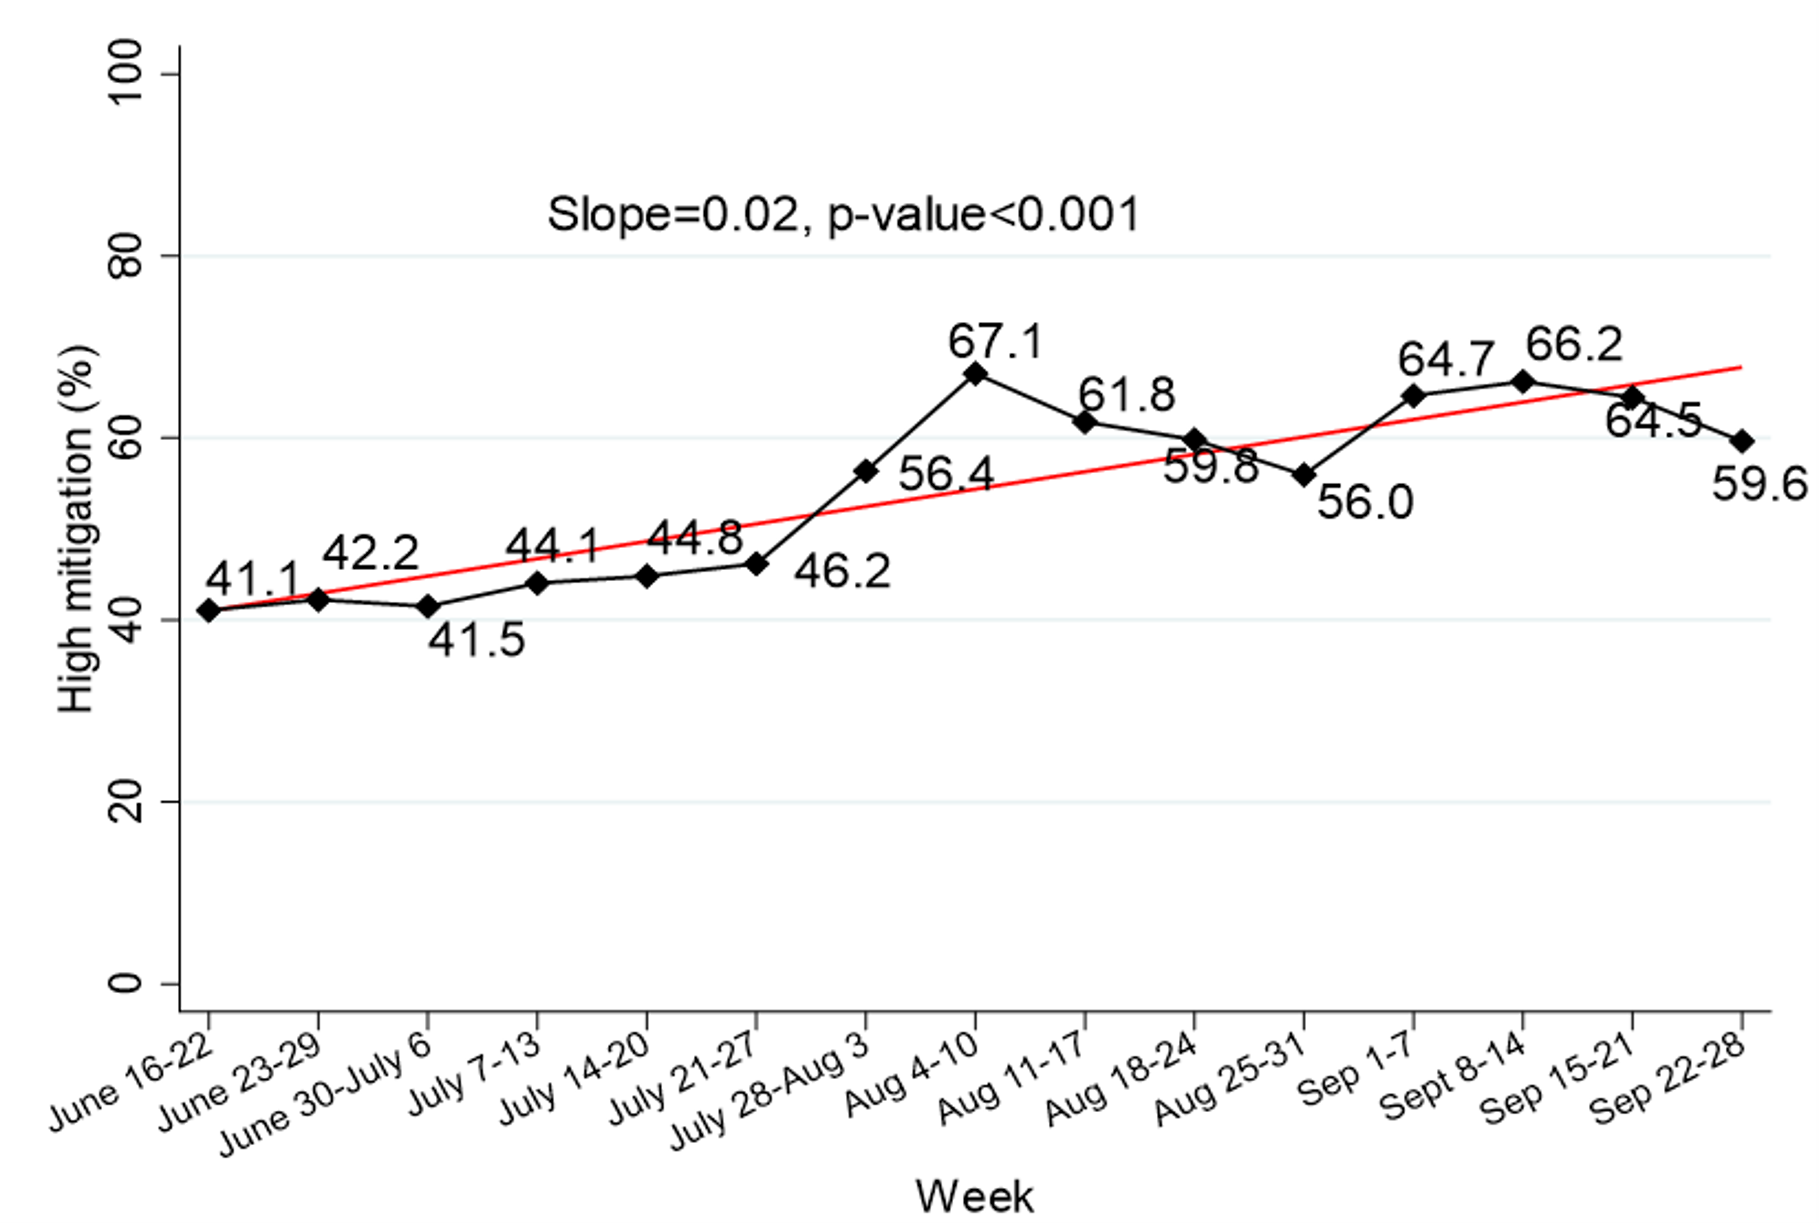
OVERALL MITIGATION
based on a cumulative score of 6 variables—percent 'high' mitigation
_____
Data below are based on Social Contours and COVID-19 study, Round 8 (February 2021), n=1,099. Results are age-gender-location of residence weighted (Census 2016, Saskatchewan adult population).
Respondents' Perceptions
Not enough people follow public health orders
| By Age | By Gender | By Place of Residence |
 |
 |
 |
Public health orders have not been enforced
| By Age | By Gender | By Place of Residence |
 |
 |
 |
People are confused about public health orders
| By Age | By Gender | By Place of Residence |
 |
 |
 |
People are tired of restrictions
| By Age | By Gender | By Place of Residence |
 |
 |
 |
➤For respondents' perceptions of how good a job the federal and provincial governments have been doing with respect to vaccination, see the Vaccines drop-down (below).
TRENDS: Perceptions have changed over time
May 26, 2020 to January 2, 2021
How good a job do you think the provincial government has been doing in getting people vaccinated? (Jan 1-Feb 2, 2021 wave, n=737)
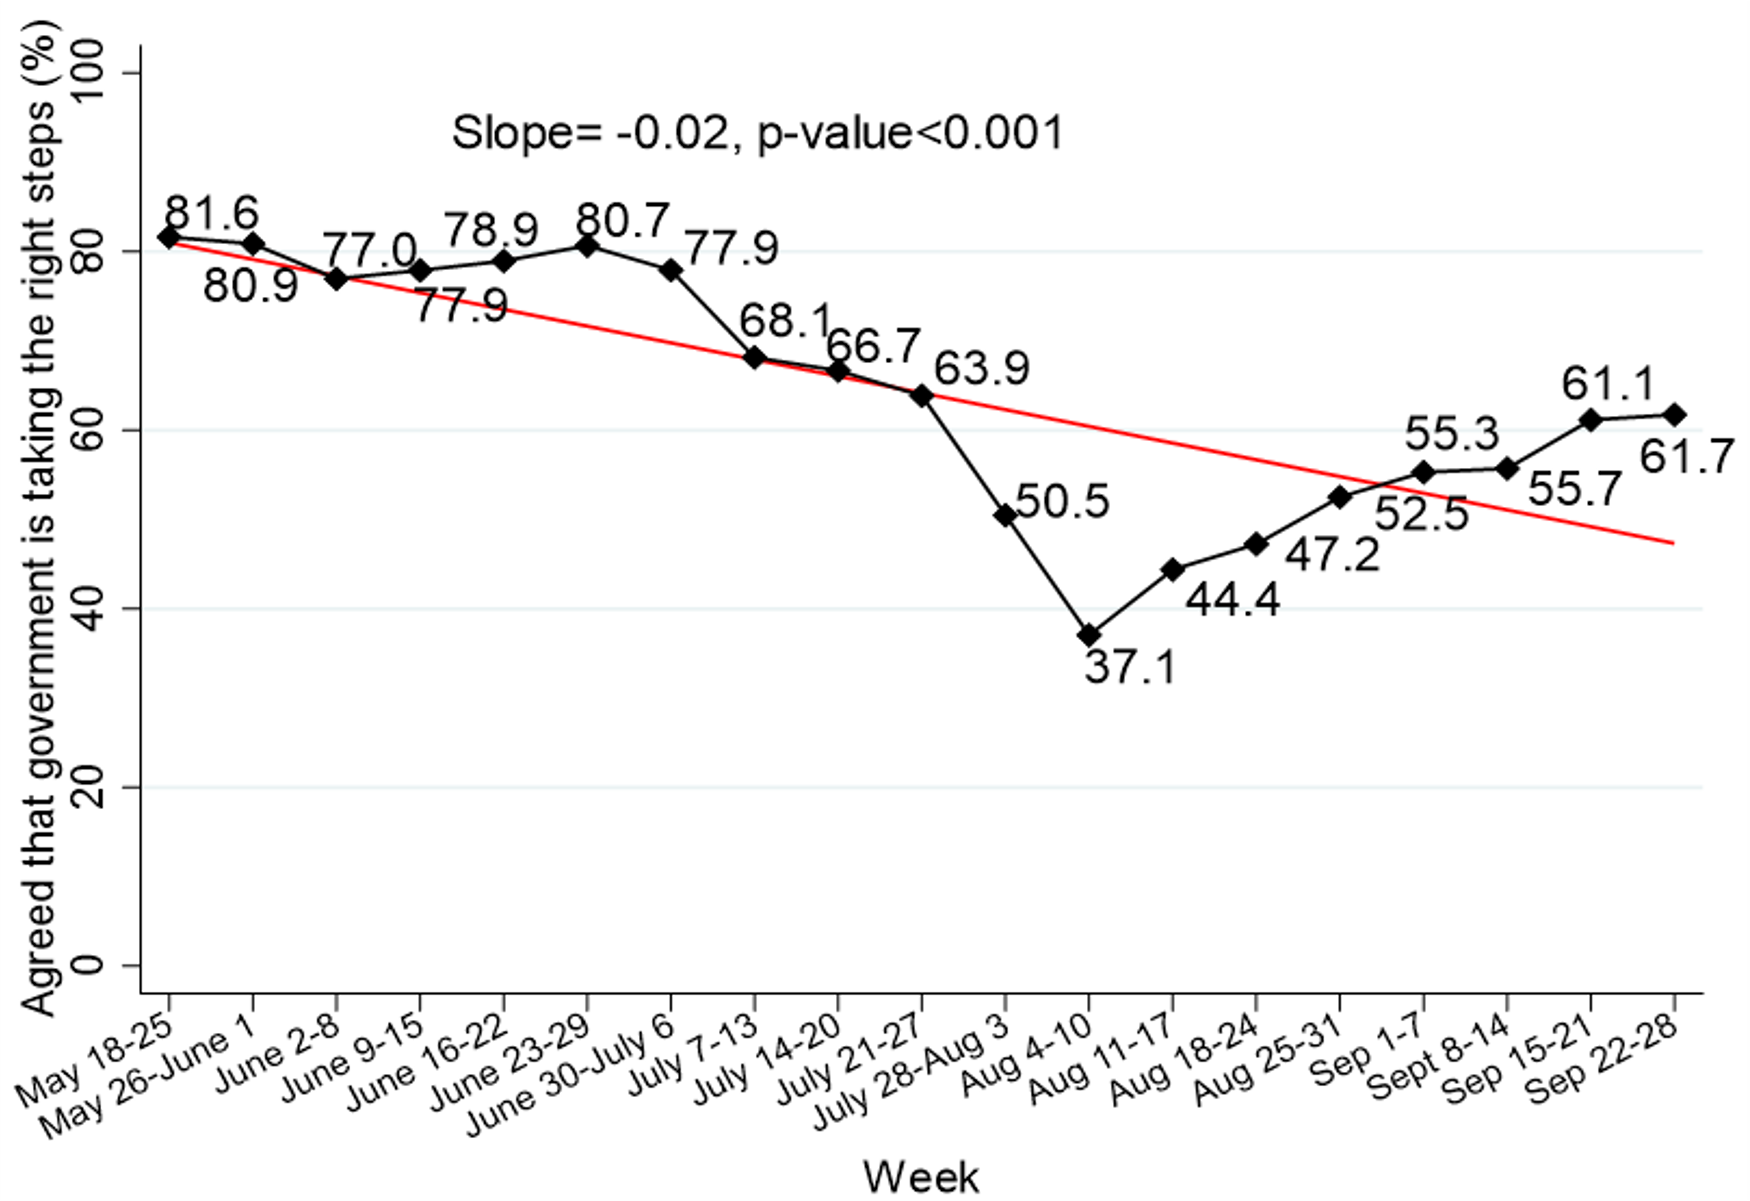
1. The Government is taking the right steps at this time to control the pandemic.
In mid-December, we are seeing the lowest percentage of people agreeing that the provincial government is taking the steps needed to stop the spread of the virus—only 34%.
Similar percentages were seen in early Aug, this was a time that the province was dealing with the series of outbreaks in Hutterite colonies.
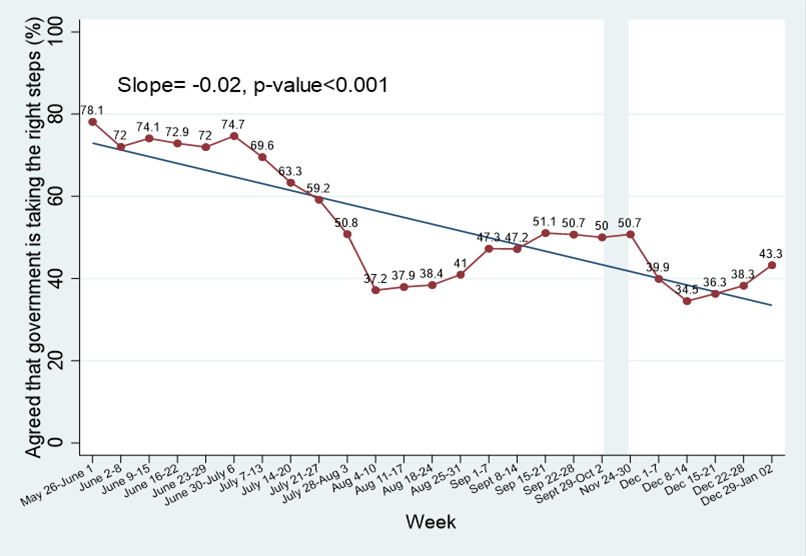
This trend graph shows Saskatchewan respondents who said that the provincial government is taking the steps needed to stop the spread of the virus.
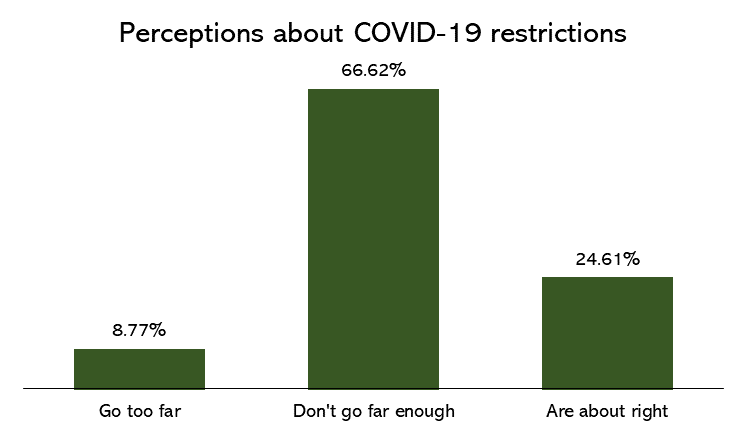
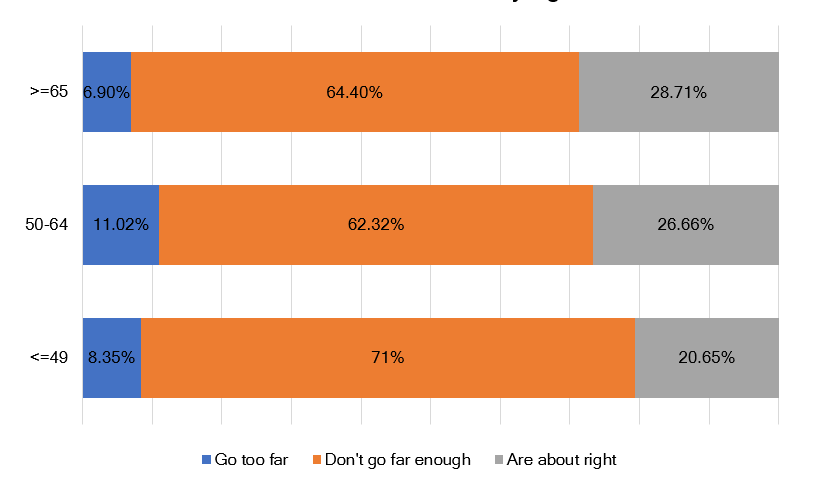
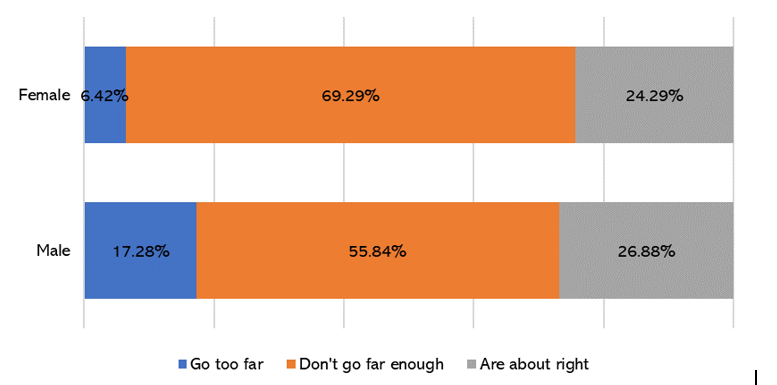
2. 67% of Saskatchewan respondents say restrictions don’t go far enough.
In round 6 of the Social Contours and COVID-19 survey (November 23, 2020 to January 2, 2021), we asked: “Overall, thinking about restrictions that have been put in place in your area to prevent the coronavirus from spreading, do you think these restrictions go too far, don't go far enough, or are about right?” 1544 responded in this round and here are the results:
| By Age | By Gender | By Place of Residence |
| Pearson chi-squared p=0.016 | Pearson Chi-squared p<0.001 | Pearson Chi-squared p<0.001 |
|
|
|
 |
_____________
Data below are based on Social Contours and COVID-19 study; as of May 2, 2021; this includes 10,627 all respondents to date (unless otherwise indicated). Results are age-gender-location of residence weighted (Census 2016, Saskatchewan adult population) and data are 4-week moving averages when time trends are presented. In this brief, some notable findings in the latest iteration of the Social Contours and COVID-19 study are reported (April 2021, n=1,280)
Vaccine intention amongst adults in Saskatchewan
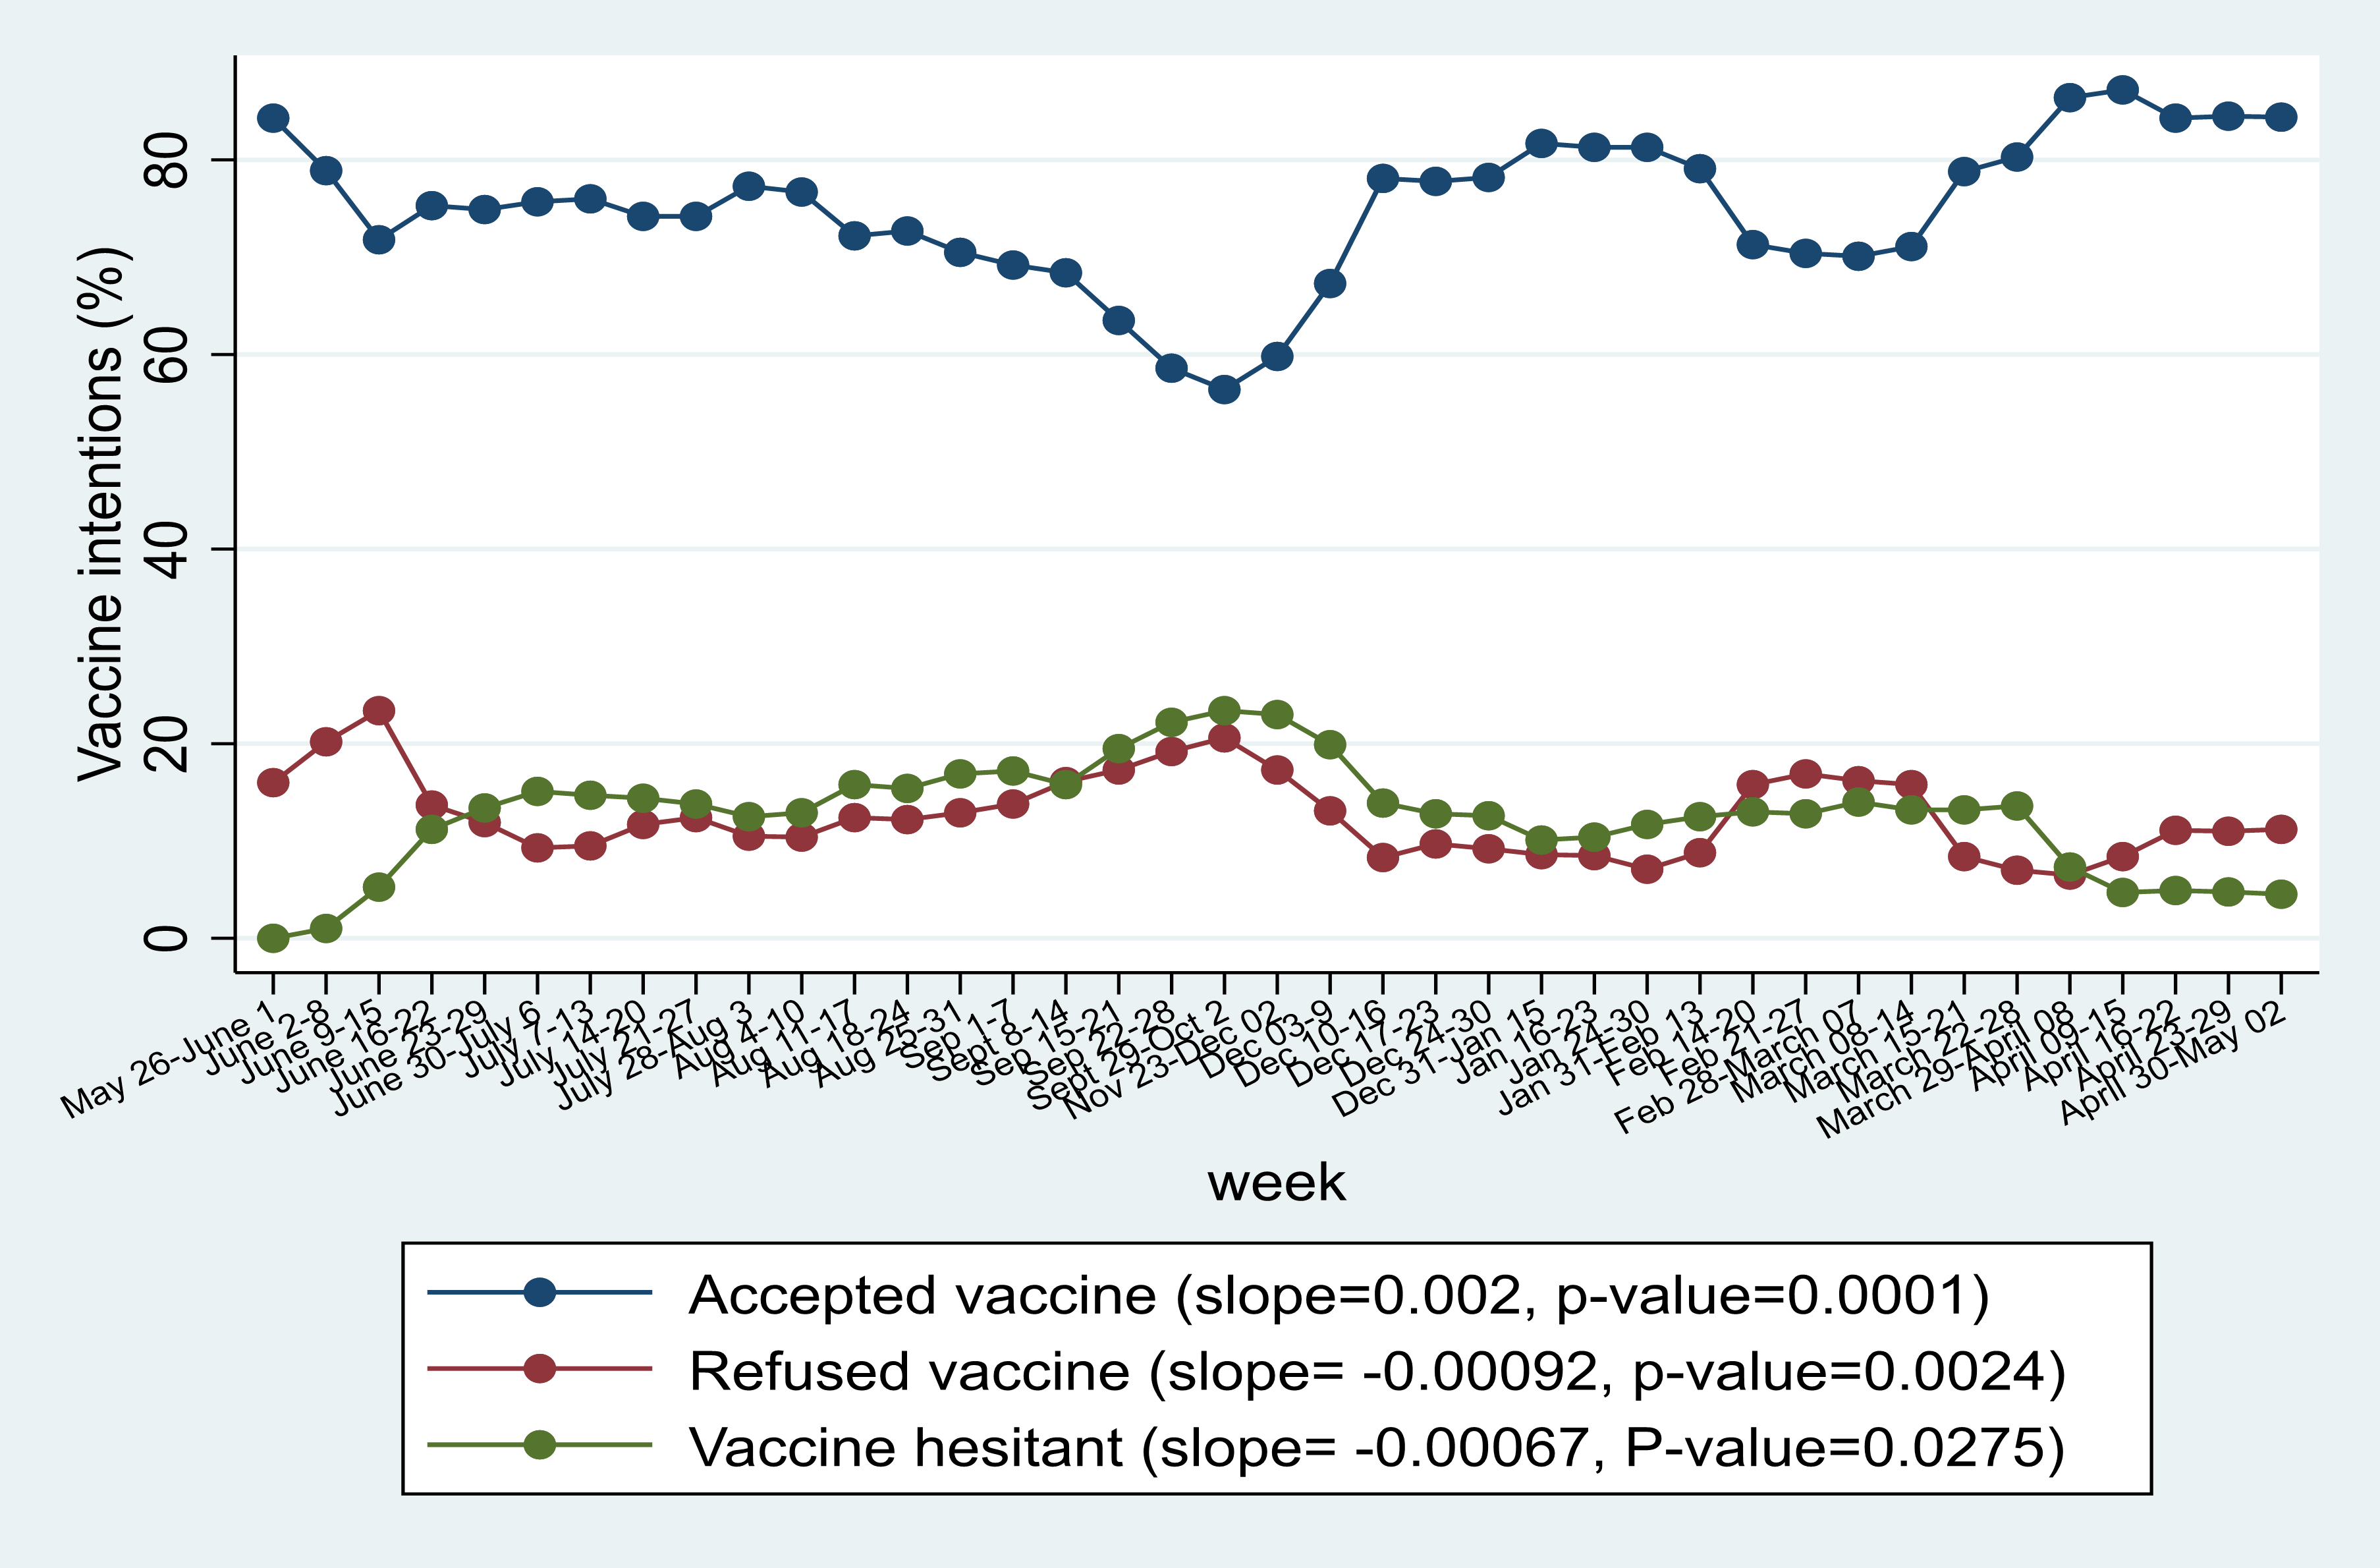
In the April 2021, vaccine acceptance experienced an all-time peak of 87.2% the second week of April, followed by a slight decrease to 84% for the remainder of the month. Vaccine hesitancy continues to trend downward from the September 2020 peak, plateauing at roughly 4.7% throughout April 2021. As of May 2, 2021, vaccine refusal had increased to 11.2%, up from 6.5% at the end of March 2021.
Respondents who will get a vaccine if one is available, by region.
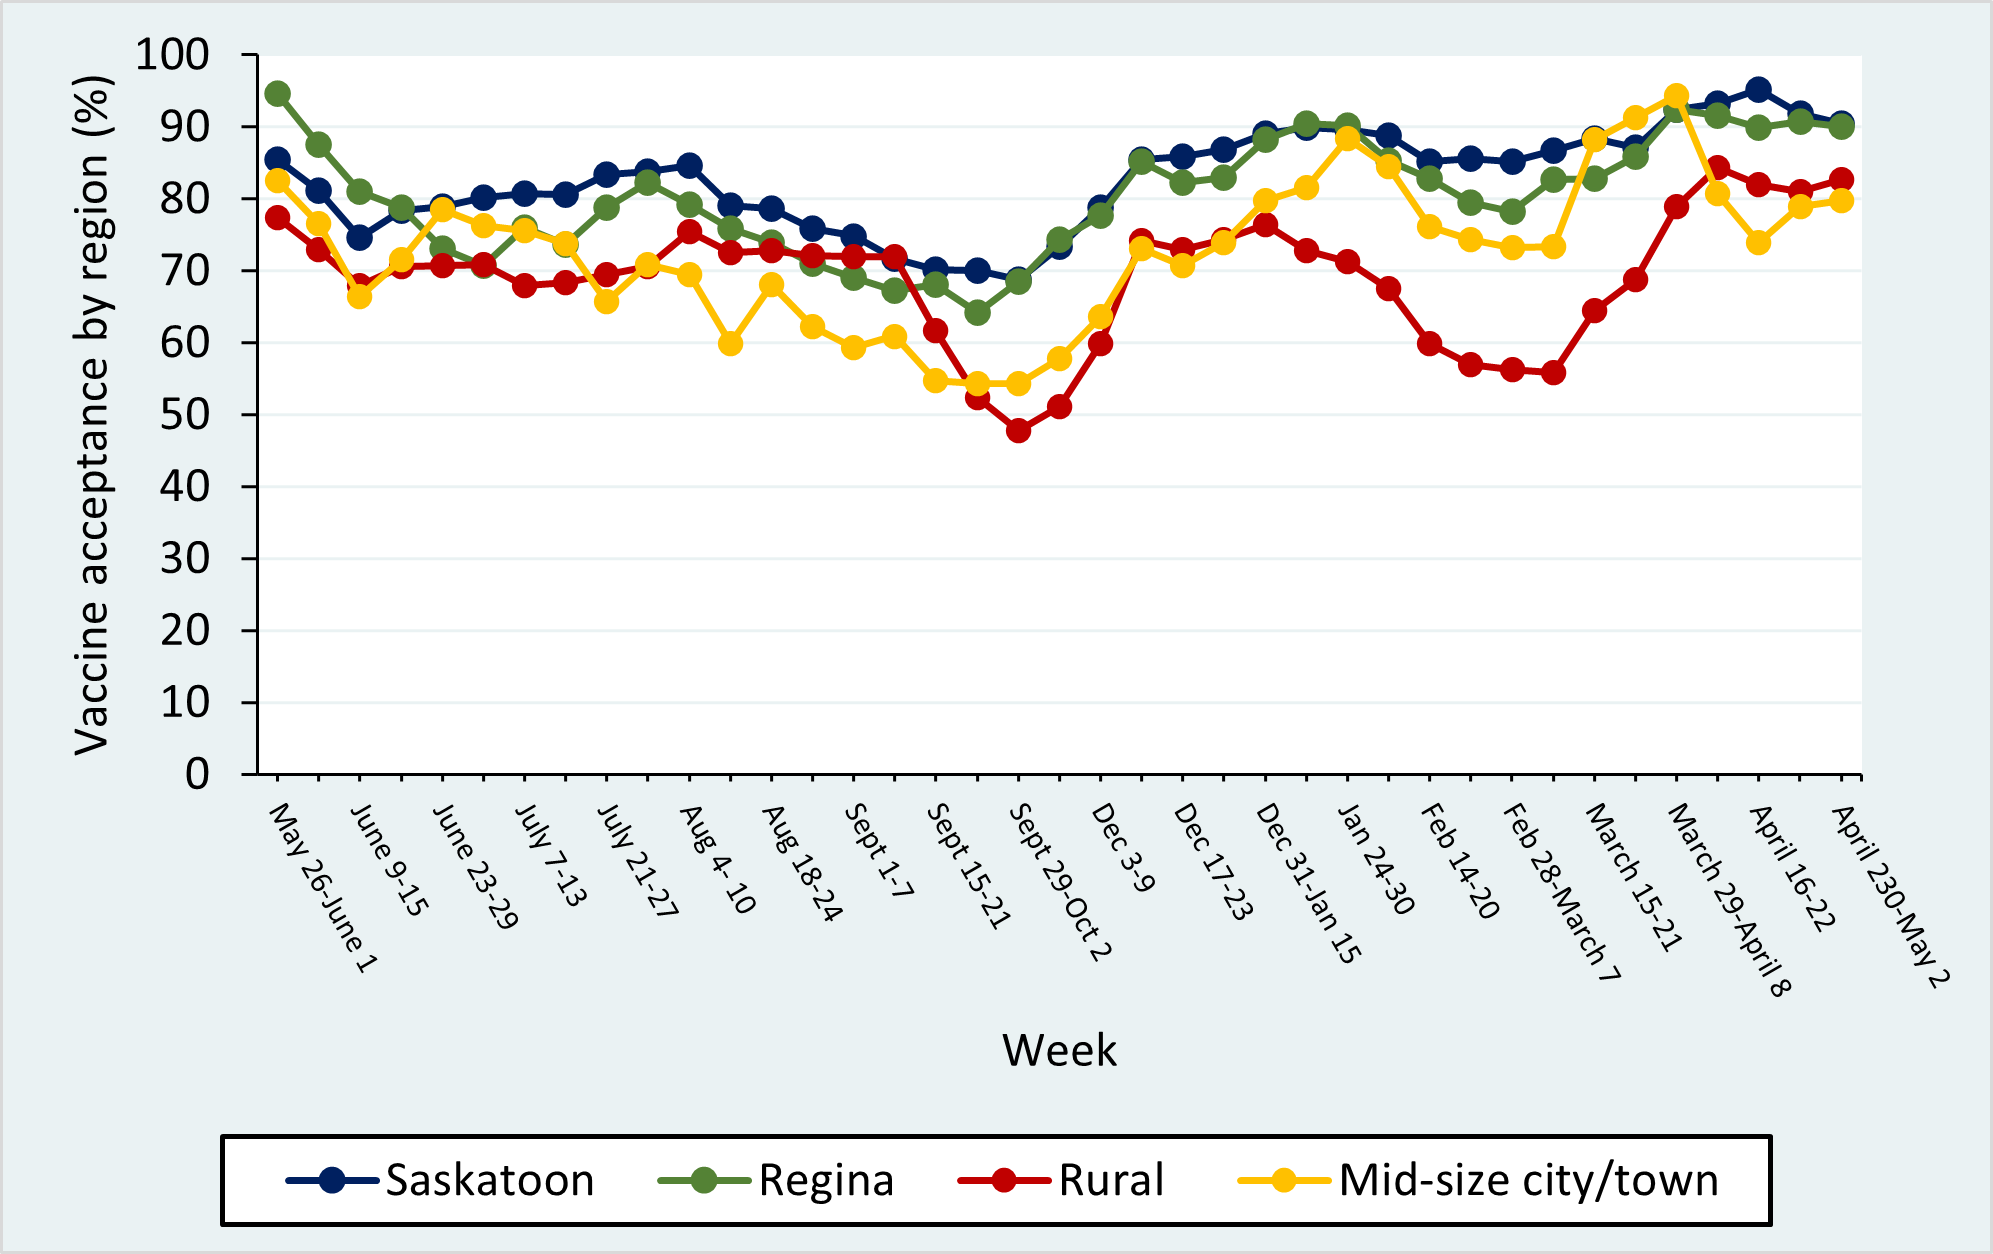
In agreement with earlier trends, vaccines acceptance continued to be lower in rural (83%) and mid-size cities/towns (79%) compared to Regina (90%) and Saskatoon (90%) in April 2021.
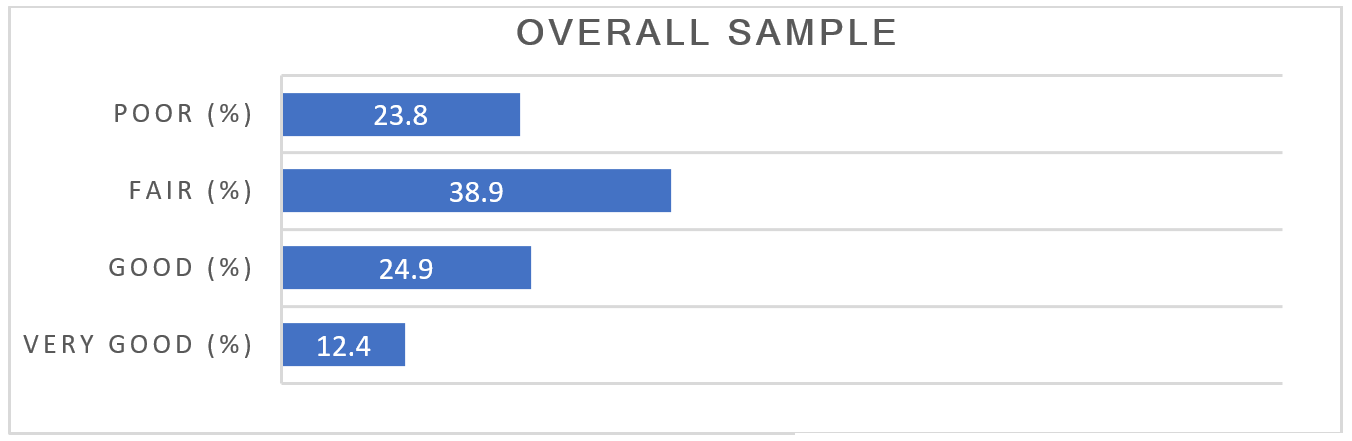
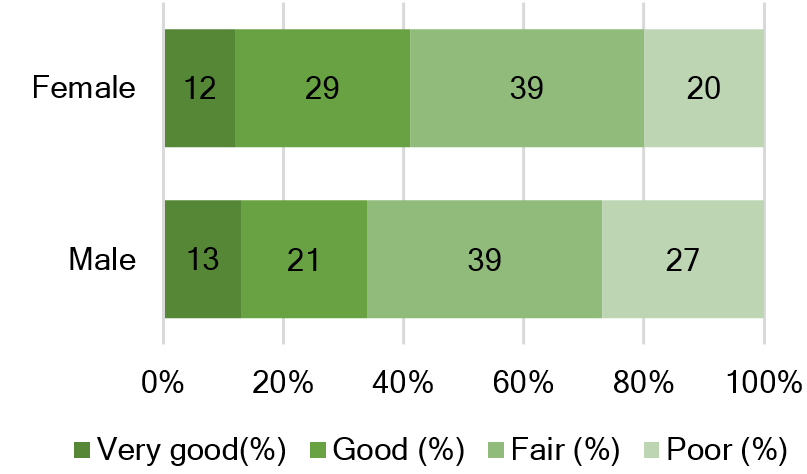
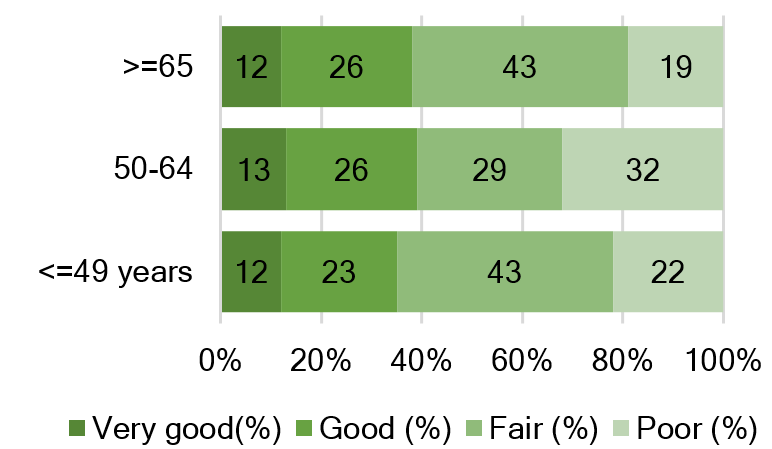
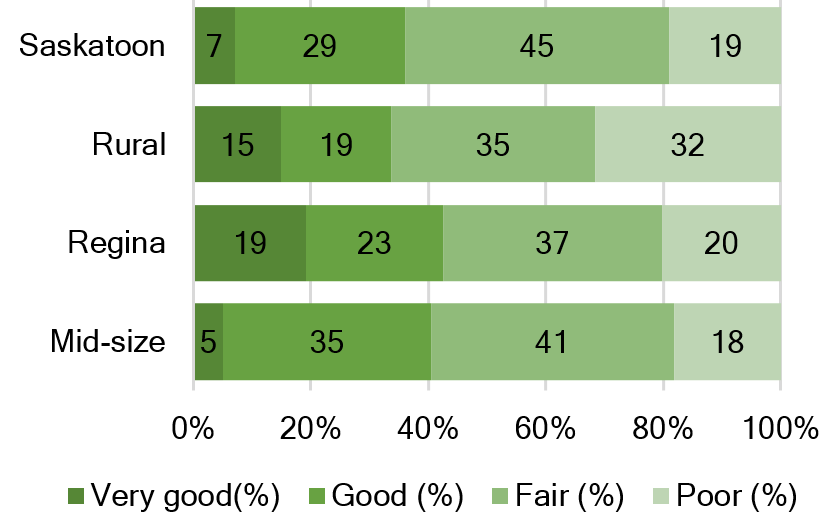
How good a job do you think the provincial government has been doing in getting people vaccinated?
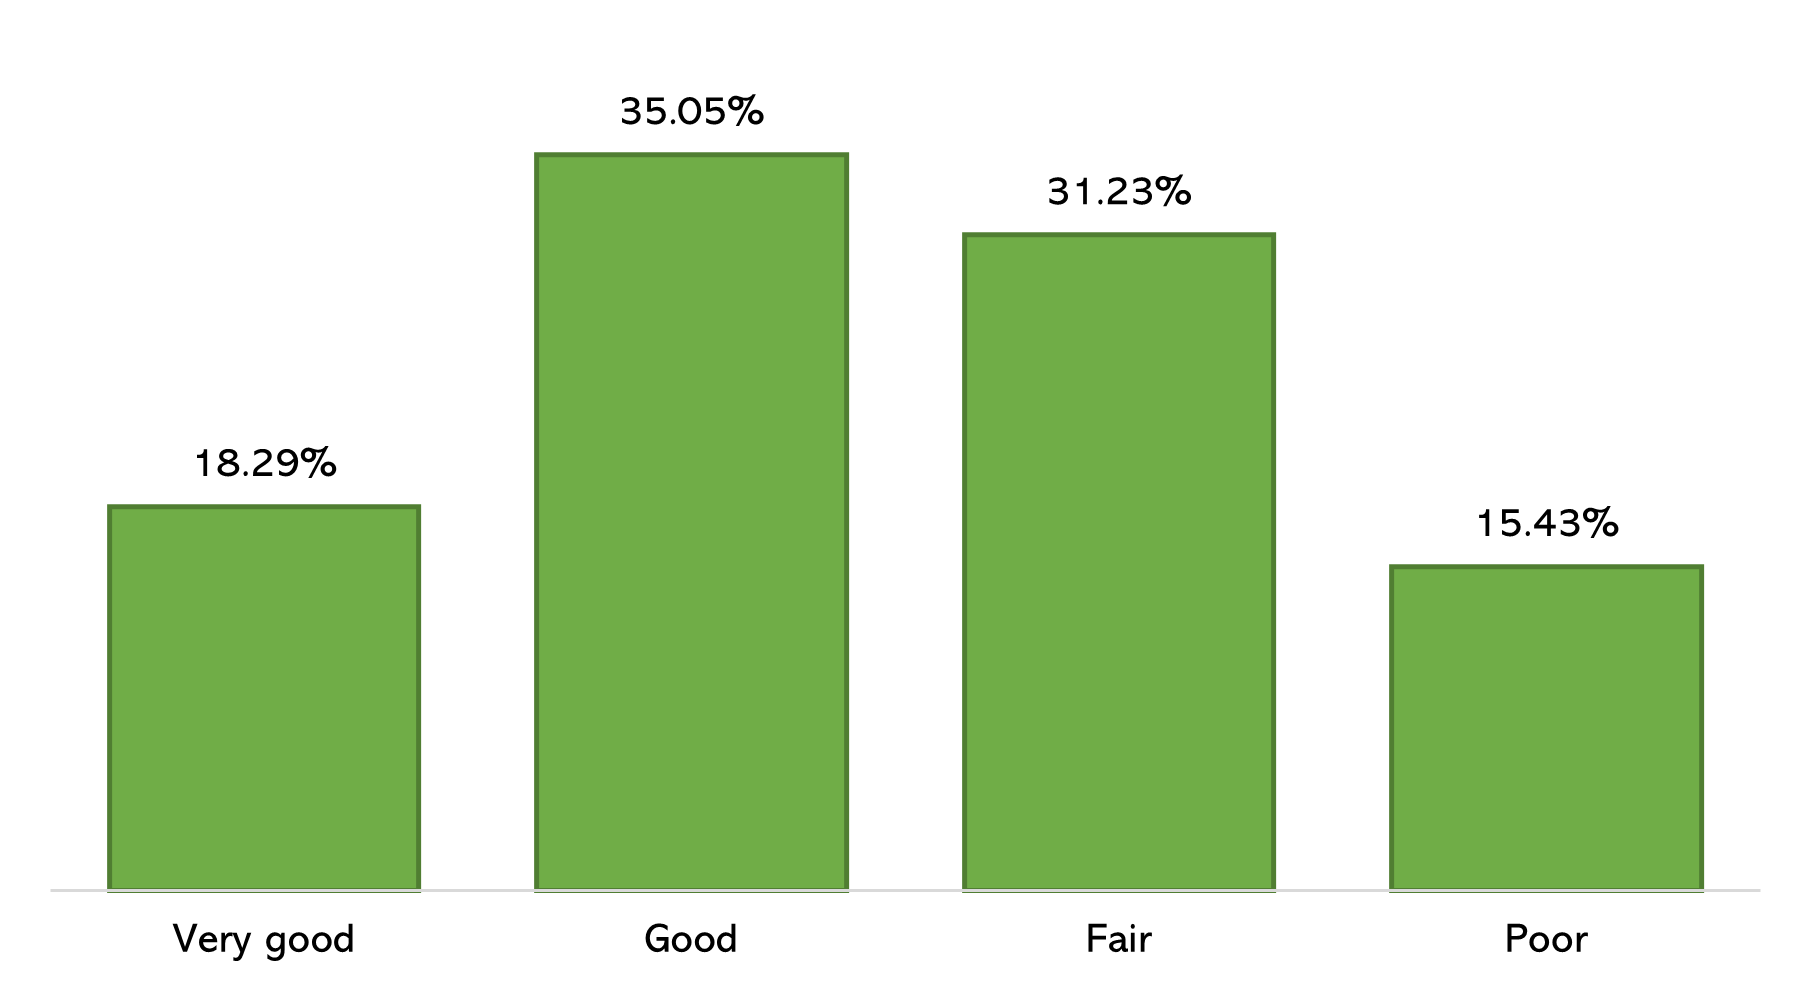
From mid-April to early May 2021, 53% of repsondents said that the provincial government had done either a very good or good job in getting people vaccinated, compared to 47% of repsondents who believed that their effort was fair or poor (n=1,280).
Thinking about the overall immunization plan (phase 1 and phase 2), will this help us come out of the pandemic sooner than later?
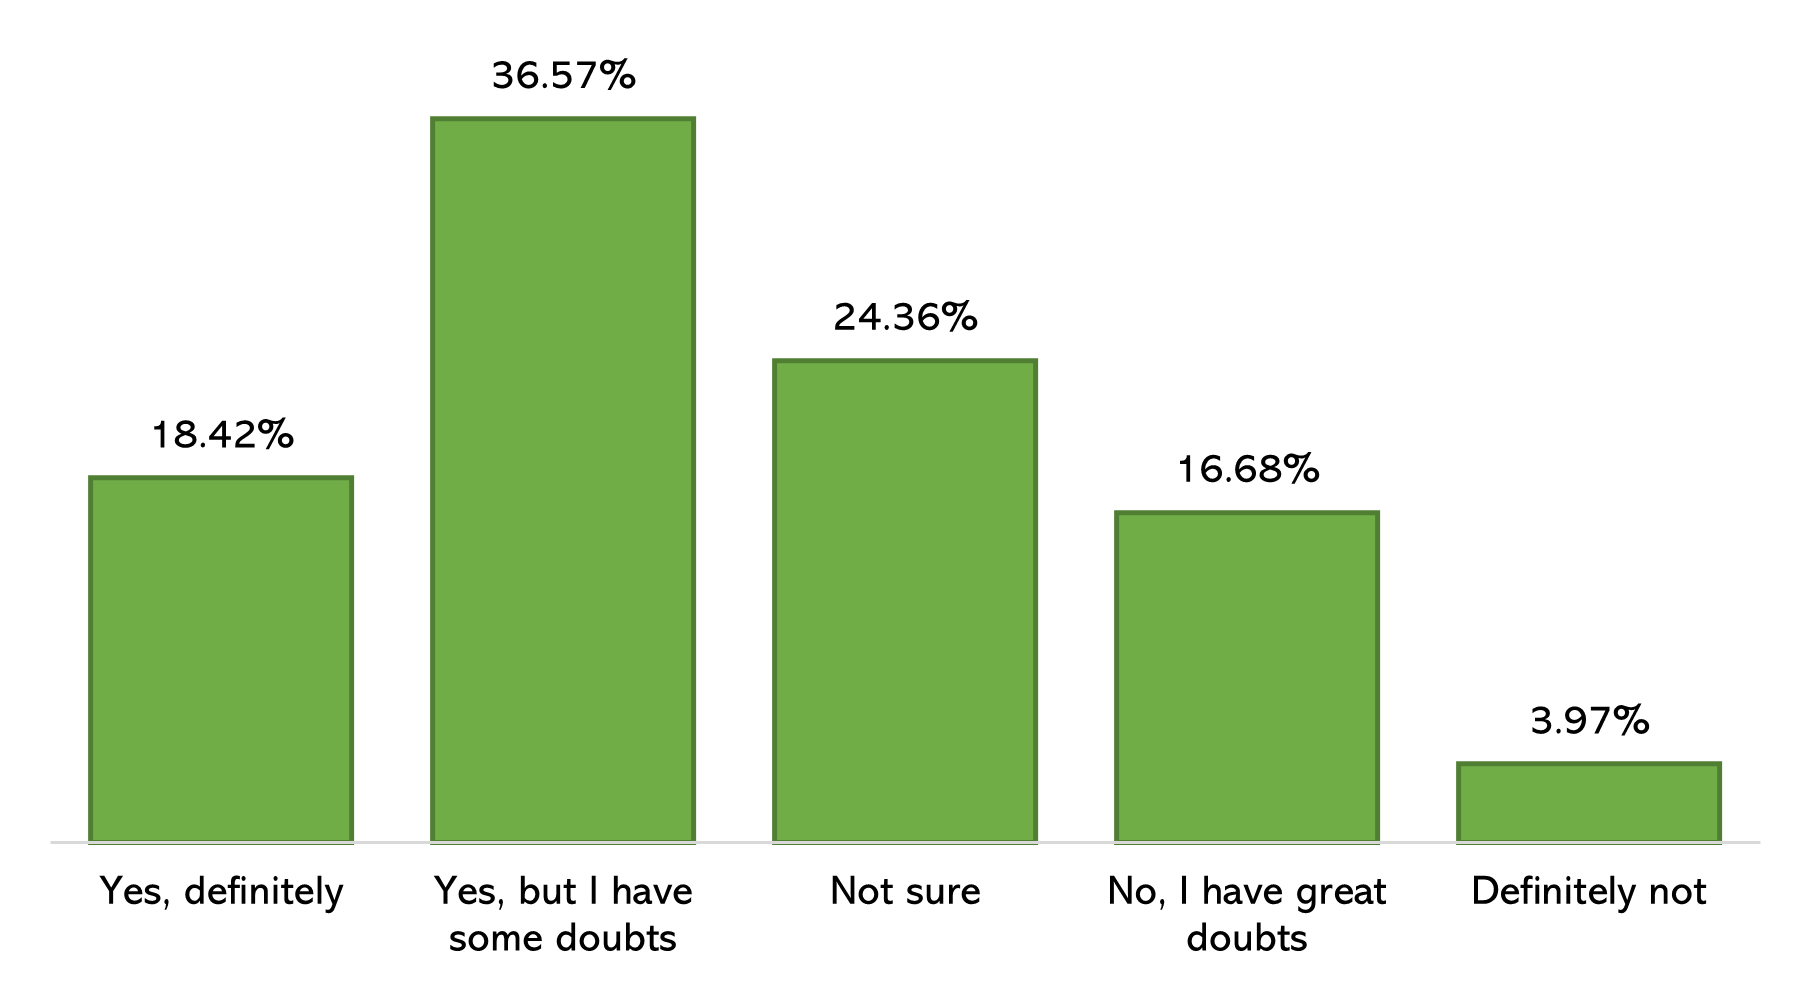
The majority of respondents (55%) believe the immunization plan will help us come out of the pandemic sooner, but 45% of those respondents were not sure or had doubts that it will (n=1,280).
______________________________________________________
Previous Results
How good a job do you think the federal government has been doing in getting vaccines and distributing them to provinces?
(Jan 1-Feb 2, 2021 wave, n=737)
|
|
 |
Thirty-seven percent of respondents in January 2021 said that the federal government is doing a good or very good job in distributing vaccines to provinces. At the other end, 24% said that the federal government is doing a poor job. Those in 50-64 age bracket, from rural Saskatchewan, or male respondents were more likely to say the federal government was doing a poor job.
COVID-19 vaccines: who is ready, refusing, or sitting on the fence?
Key Take-aways
-Results from Social Contours and COVID-19 study conducted in Saskatchewan, May 4, 2020 to January 2, 2021
- Vaccine Readiness
- Vaccine Hesitancy and Refusal (jump to Part 2)
Part 1 - Vaccine Readiness
Part 1a. Vaccine readiness for COVID-19 over time in Saskatchewan, May to January 2, 2020
- Among the 6998 Saskatchewanians who responded to the Social Contours longitudinal panel survey, the proportion indicating they would get a vaccine for COVID-19 when one is available (“vaccine-ready”) changed over time—likely related to a host of factors, including the context of vaccine development, outbreak intensity in the province, and the stage of the pandemic in the province. In May, 87% respondents indicated that they were vaccine ready. The most notable drop in vaccine readiness occurred in September, hitting a low of 61% at the end of September. In the third week in November with the news of vaccine available imminently, those who said they were vaccine-ready climbed by almost 20 percentage points. In the beginning of January 2021, 8 out of 10 survey respondents said they were vaccine-ready.
- The trend lines for men and women showed some differences—the trend line dipping more, lower than 60%, for men in September whereas it stayed above 60% for women. Notably, for most of December including into early January, proportion of men indicating vaccine-ready was holding at in mid-70s, whereas for women it was climbing past 80%.
- The age group less than 50 years, and those in the older age group, 65 years and older, show the highest vaccine-readiness with generally 8 out of 10 indicating they are vaccine-ready particularly at the end of December.
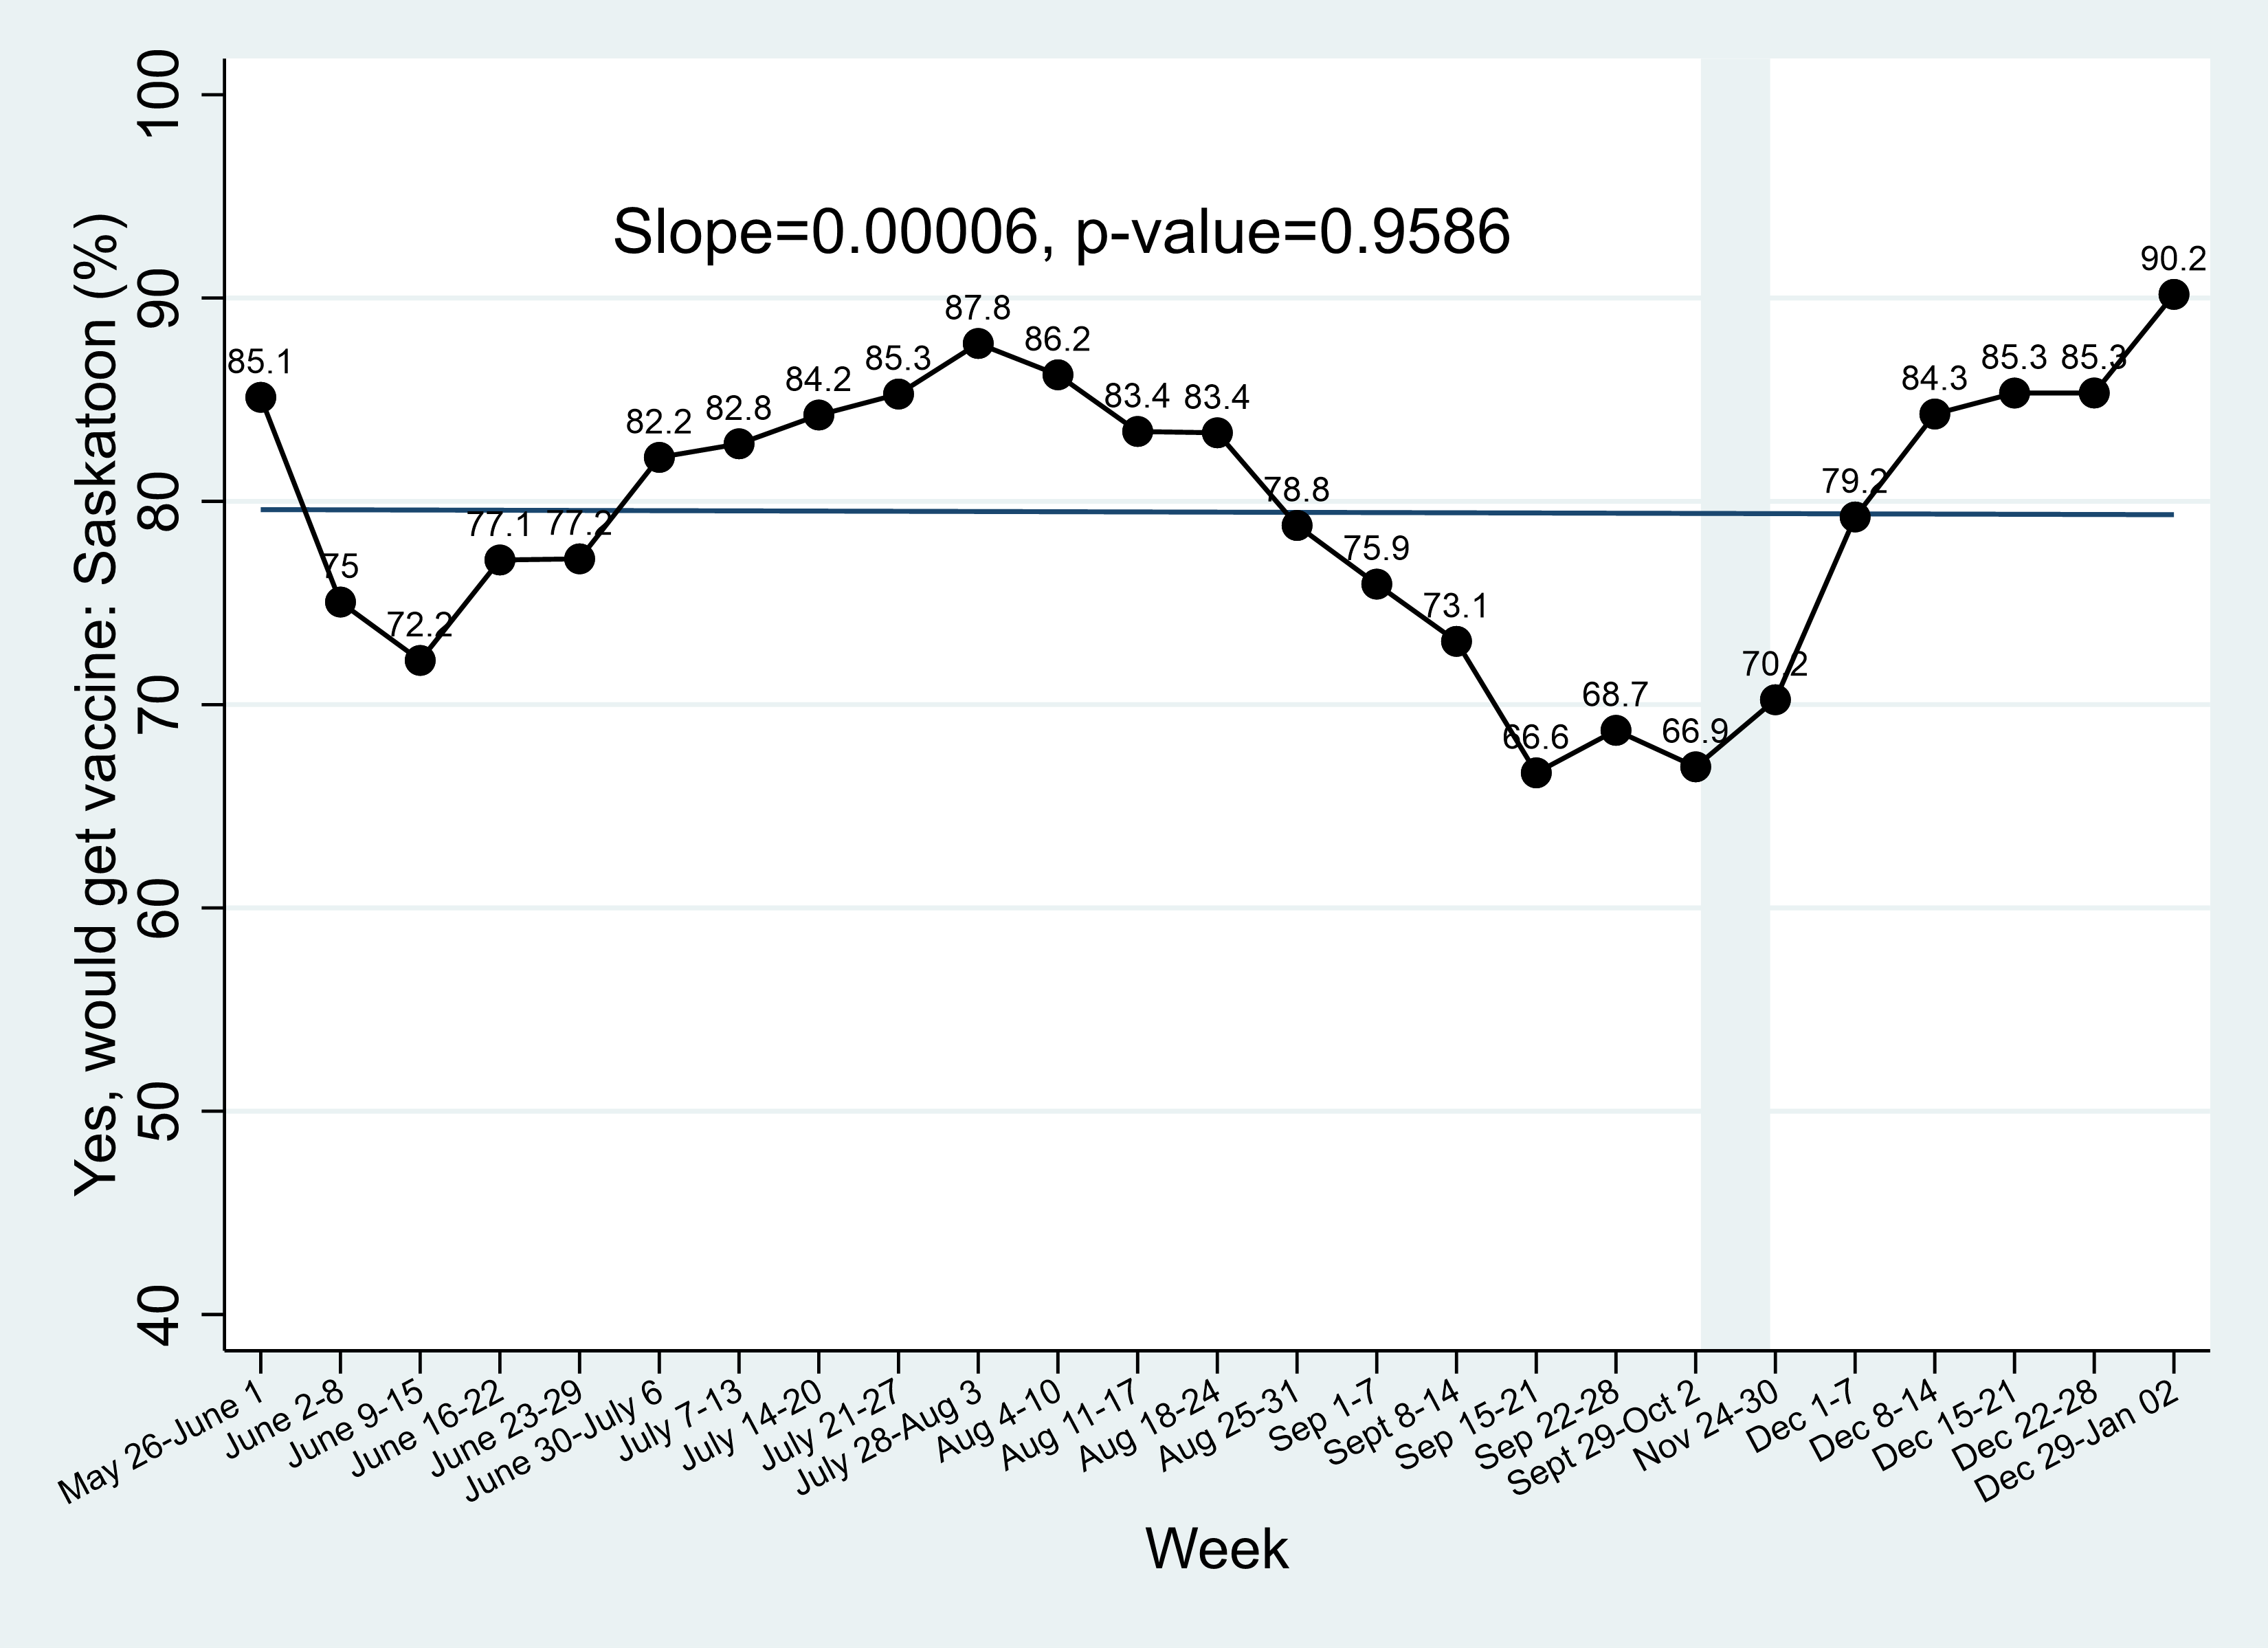
- Place of residence is associated with notable differences in vaccine-readiness over time. In December 8 out of 10 respondents (low 80s) from Regina, and in the mid-80s from Saskatoon, indicating they were vaccine-ready. In December, 7 out of 10 from rural areas and 6 out of 10 from mid-size cities and towns indicated that they were vaccine-ready.
Part 1b. Vaccine readiness by SHA Health Network zones and for Regina and Saskatoon by neighbourhoods, all data, May to January 2, 2020
- As Figure 1 shows, those who said that they were vaccine-ready were predominant in central west and south east (notable exception: south east 4) and far north east. In Saskatoon and Regina, neighbourhoods with a high proportion of vaccine-ready were adjacent to the University of Saskatchewan, and south of the Ring Road, respectively.
- Low proportions of vaccine-ready were from Health Network zones, South East 4, Central East 2, Far North West 1 and Far North West 2, South West 1, South West 2, North Central, North Central 3, North West 4.
Part 1c. Reasons for vaccine refusal or vaccine hesitancy, November-January 2, 2020
- In Nov-Dec (Nov 23-Jan 2), 1,544 Social Contours participants were asked if they would get a vaccine, if one were available. 78% said yes, 14% don’t know yet, and 8.4% no. Of those who said no to vaccine, 56% gave as the reason ‘not enough testing has been done’ (4 times more men compared to women stating this, as well as rural respondents) , 46% ‘I don’t trust the vaccine approval process’ (7% men vs 2% women, and rural respondents), 29% ‘I don’t think COVID is a threat’ (9.5% men vs 0.5% women), 11% ‘I don’t believe in vaccines’; 9% gave medical reasons for their refusal.
- Of those who said “I don’t know yet”, 72% said ‘I want to see more clinical trials’ (women stating this 2:1 compared to men), 9% who wrote in their reasons that could be described as ‘misconceptions, safety reasons, or religious reasons’. A small proportion (less 7%) said they have medical reasons or that ‘I not sure I need one’.
Figure 1. Vaccine-ready (percent) by SHA Health Network zones and for Saskatoon and Regina by neighbourhoods (n=6,767)
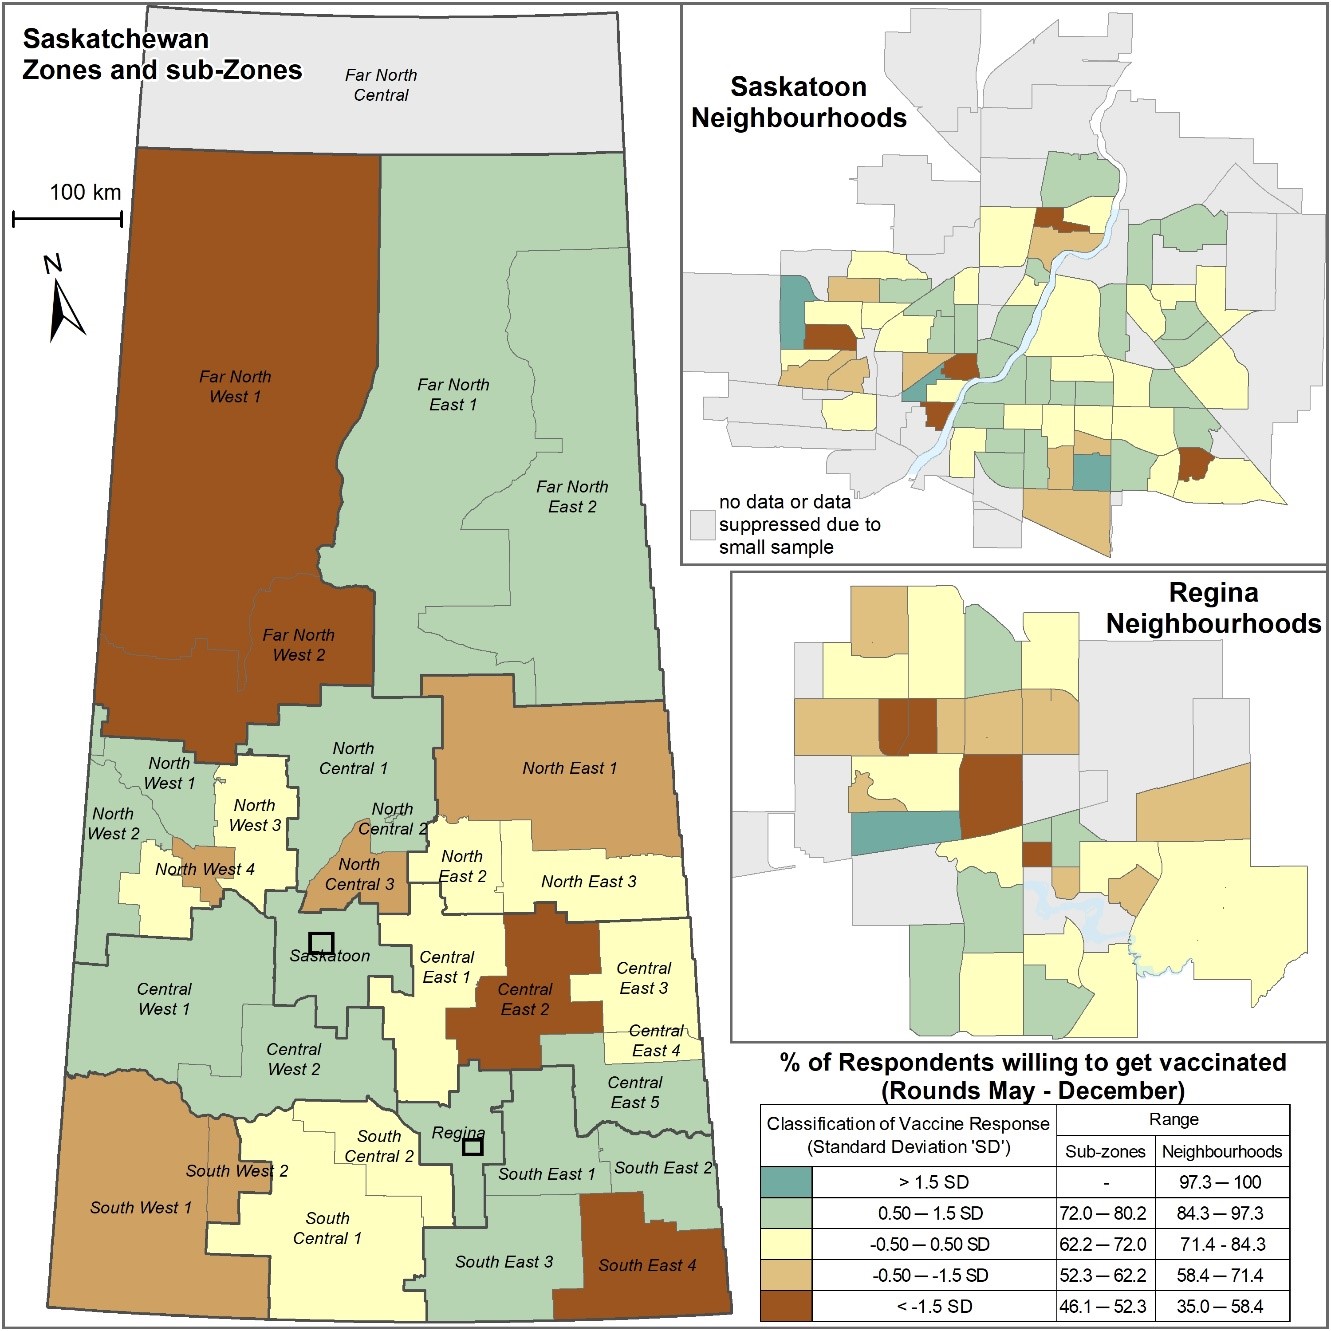
Figure 2. Trend for vaccine-readiness, Social Contours study, overall sample (n=6,998), Saskatchewan, May to Jan 2, 2020. (This and all other figures below: 4-week moving averages, weighted by age, gender and region.)
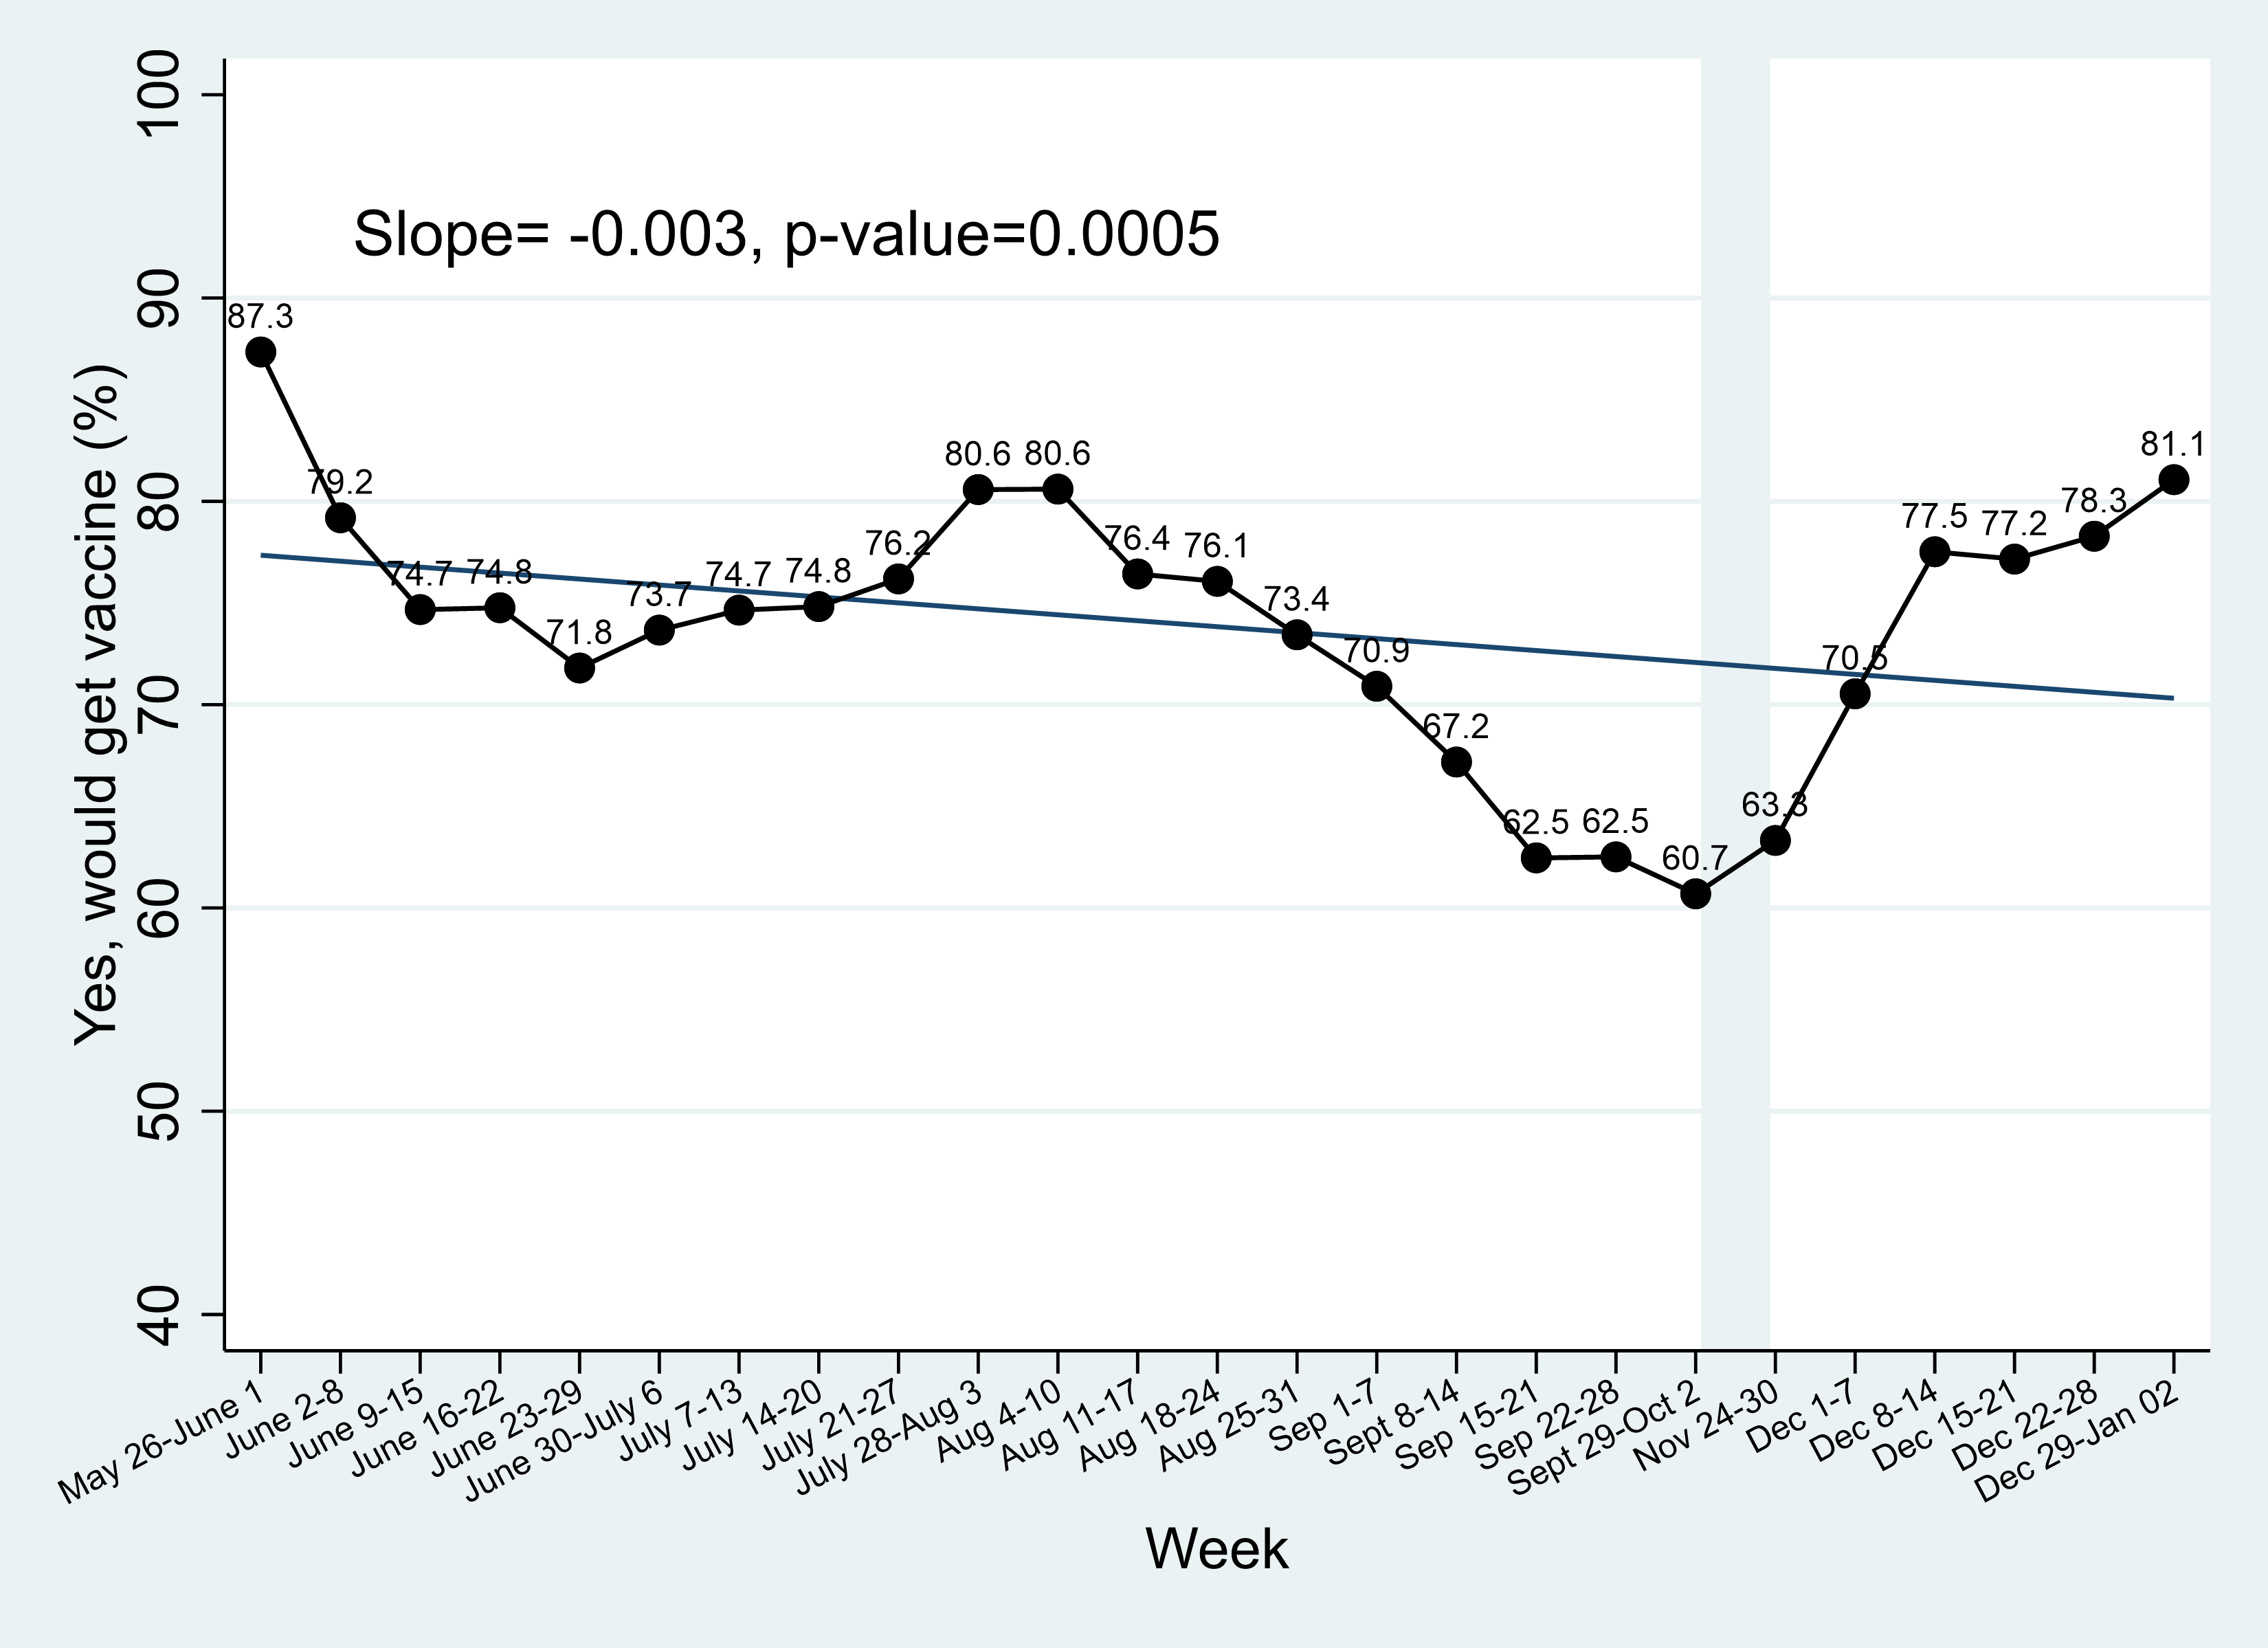
Figure 3a. Vaccine-readiness – Men, Saskatchewan
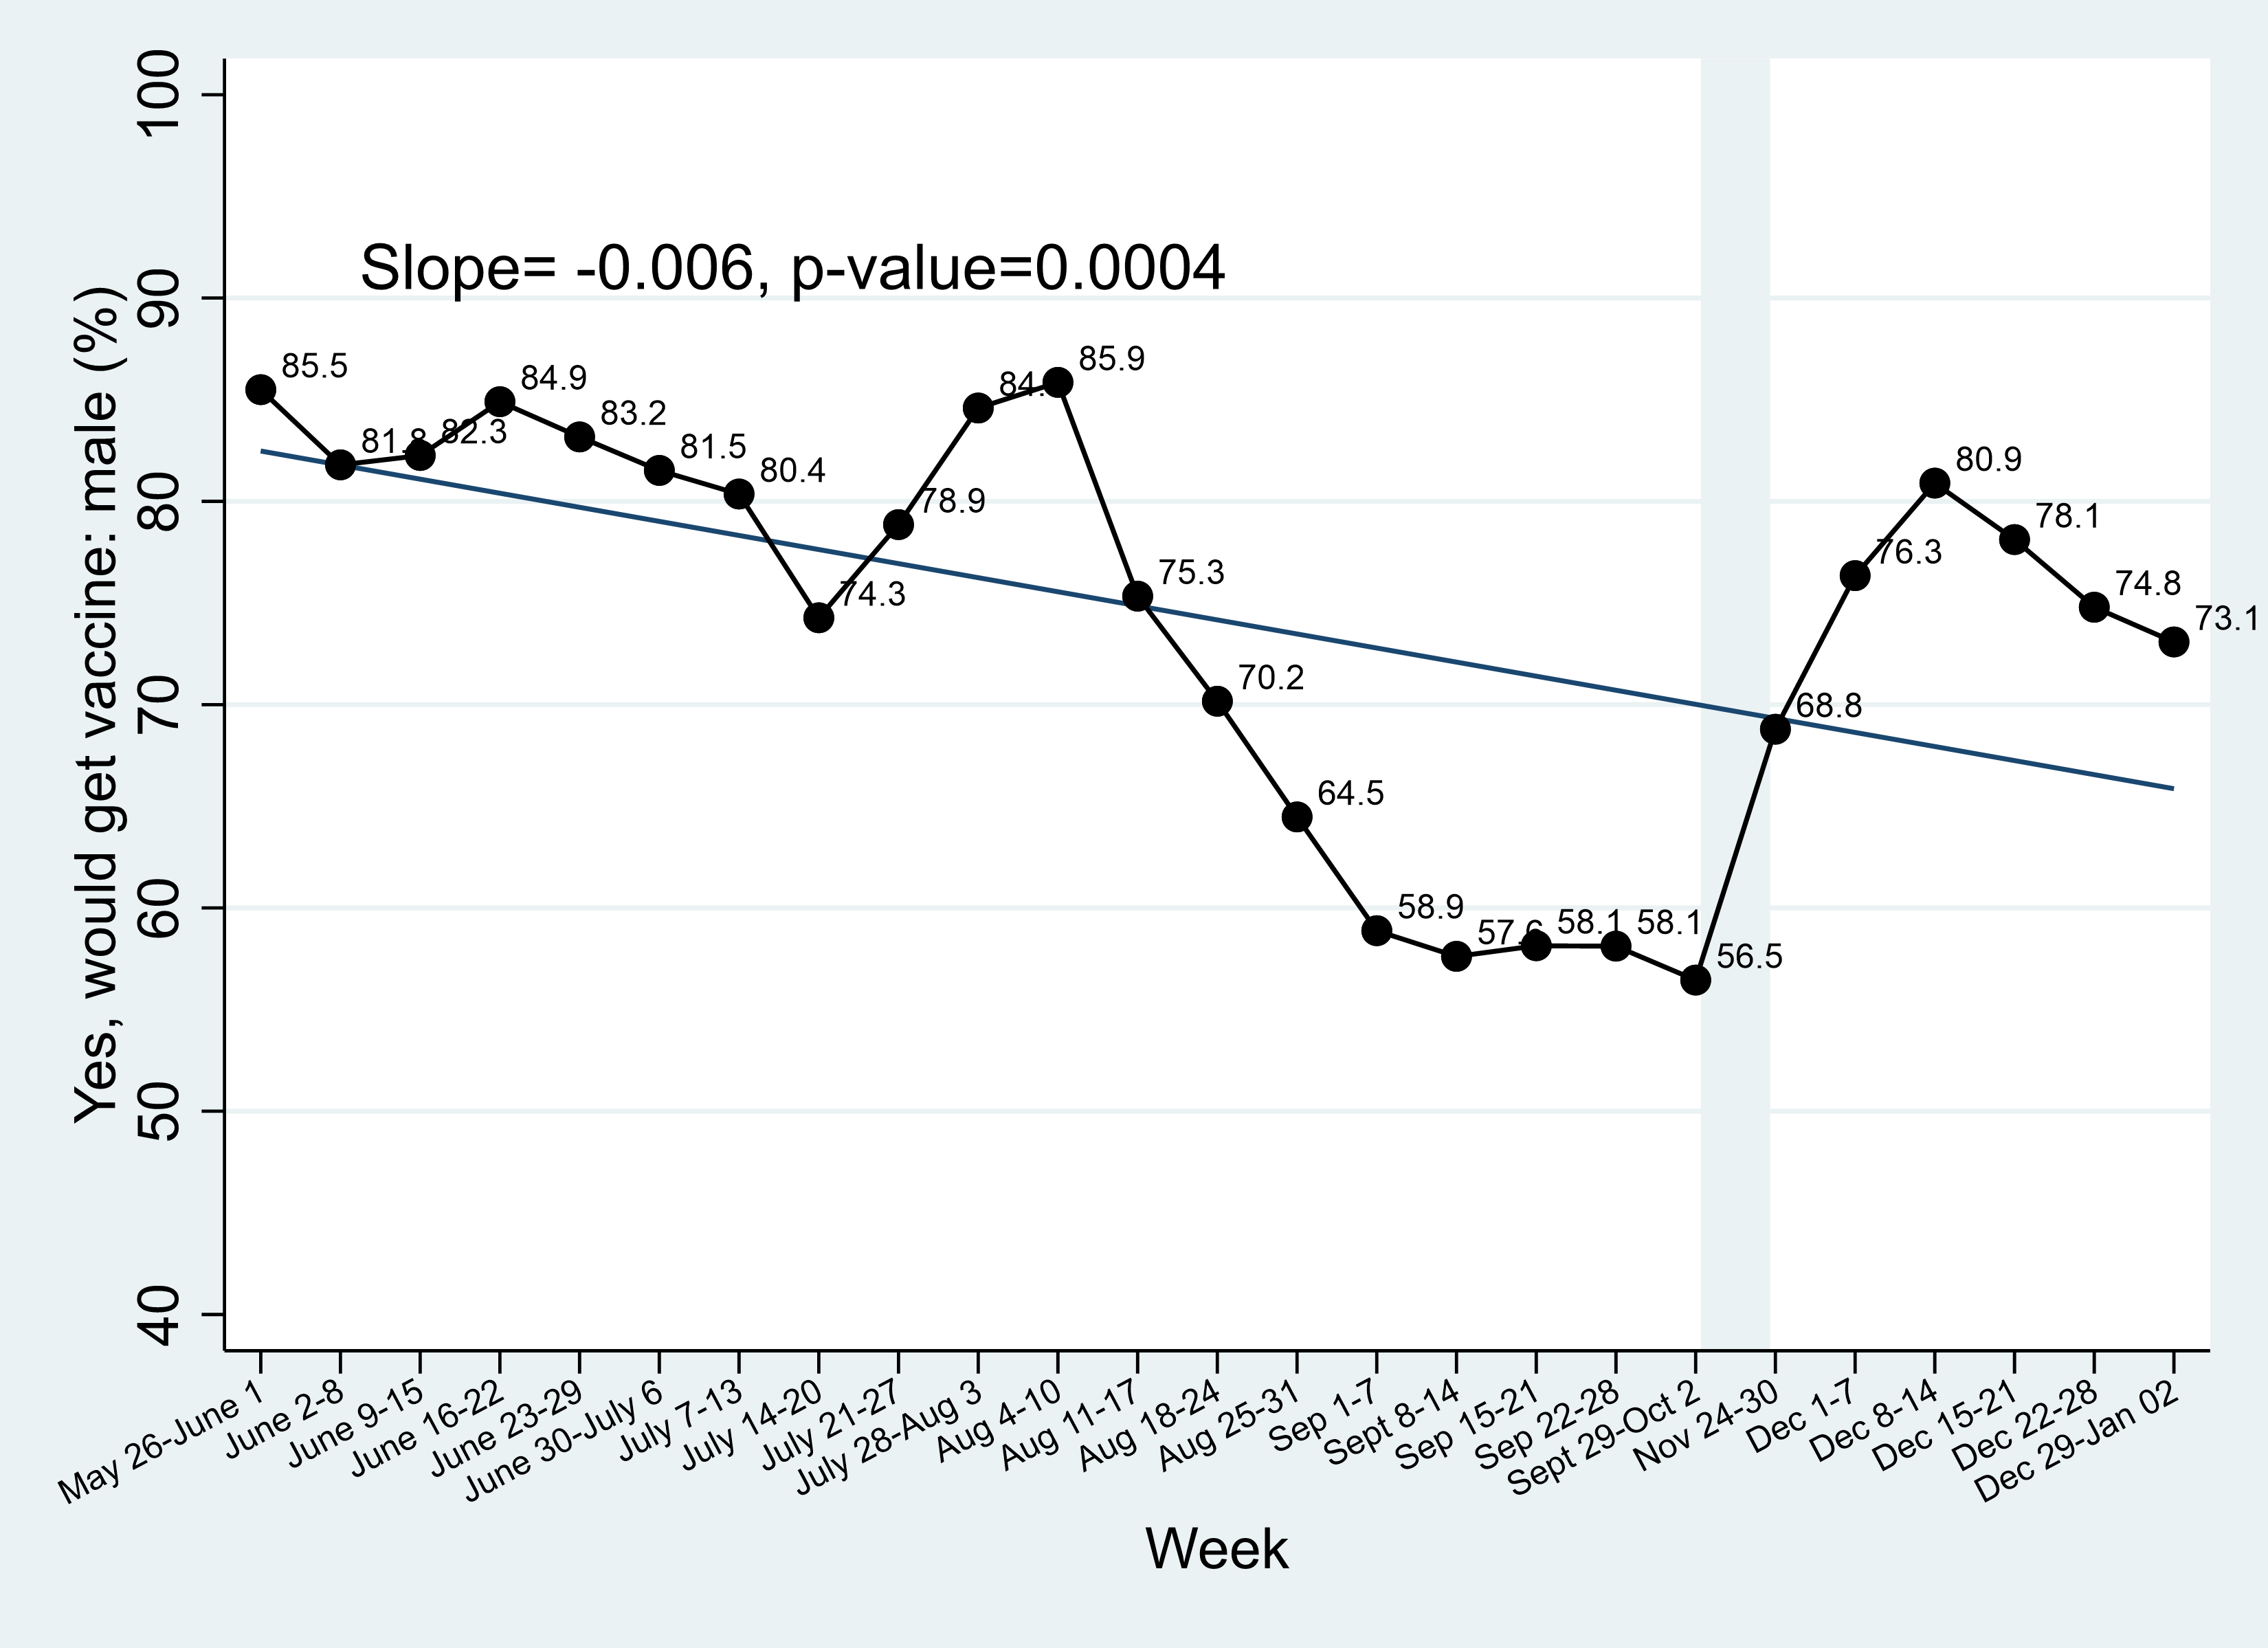
Figure 3b. Vaccine-readiness – Women, Saskatchewan
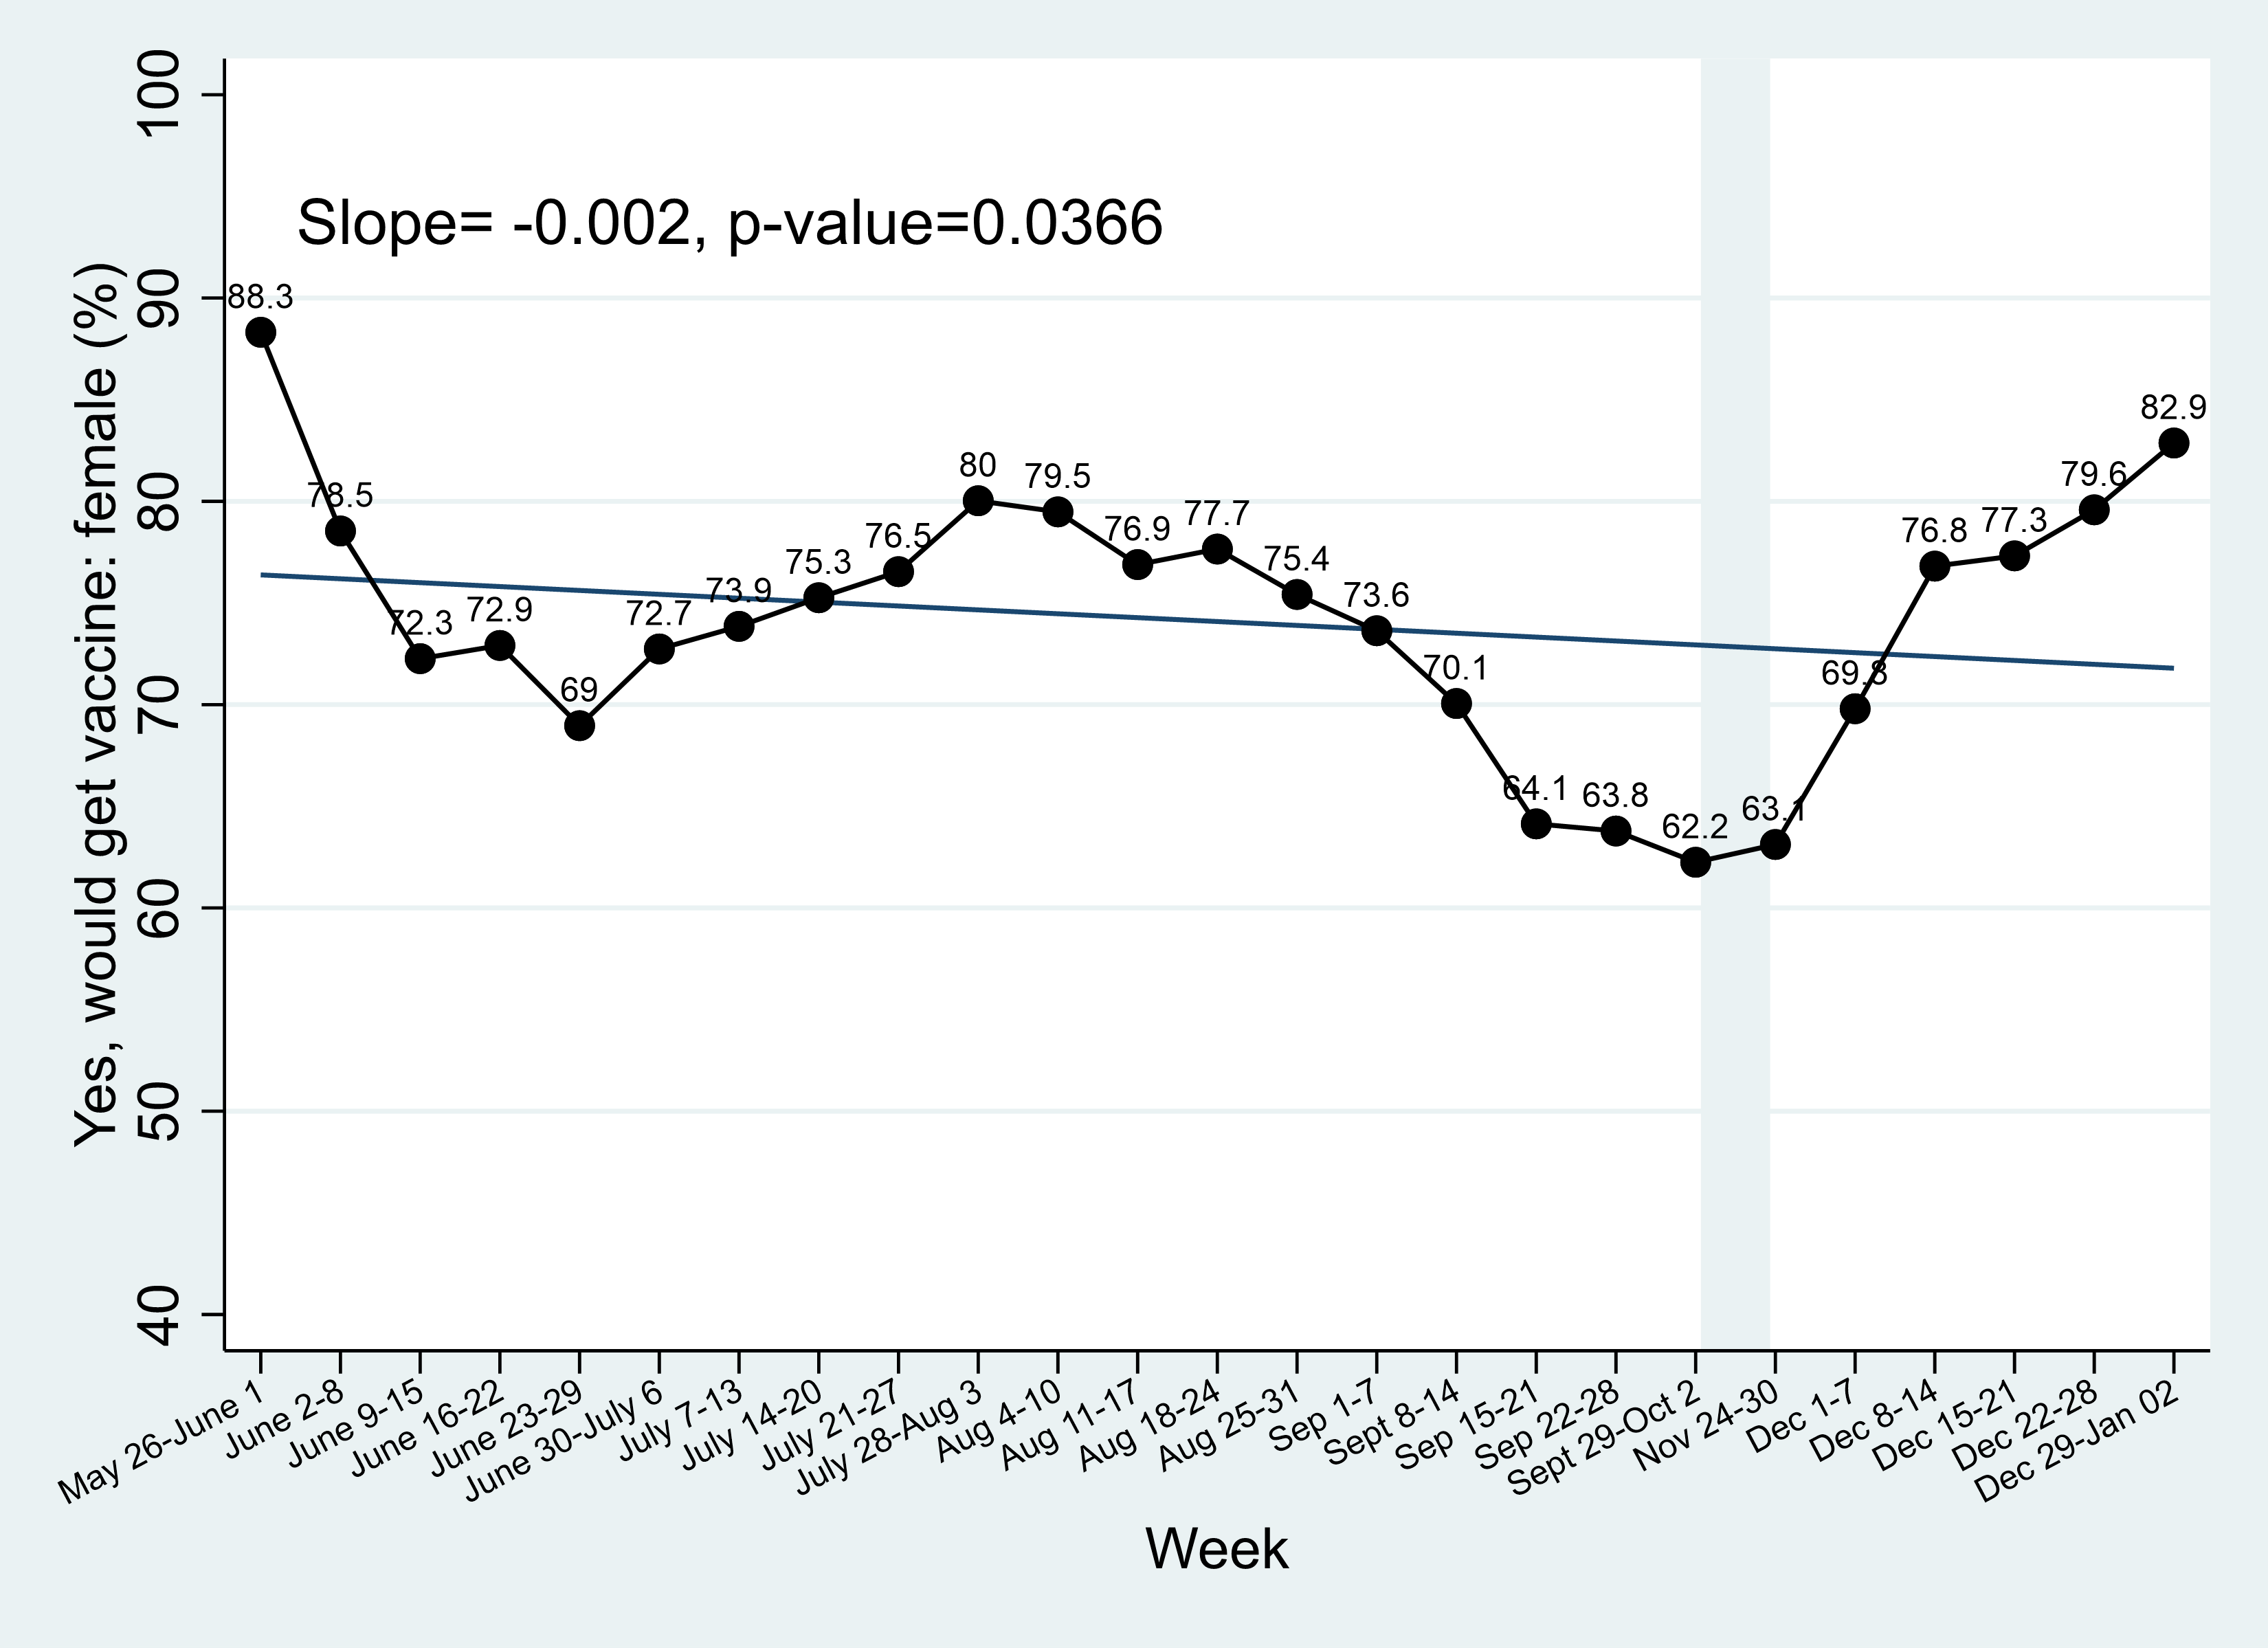
Figure 4a. Vaccine readiness – 49 years and younger, Saskatchewan
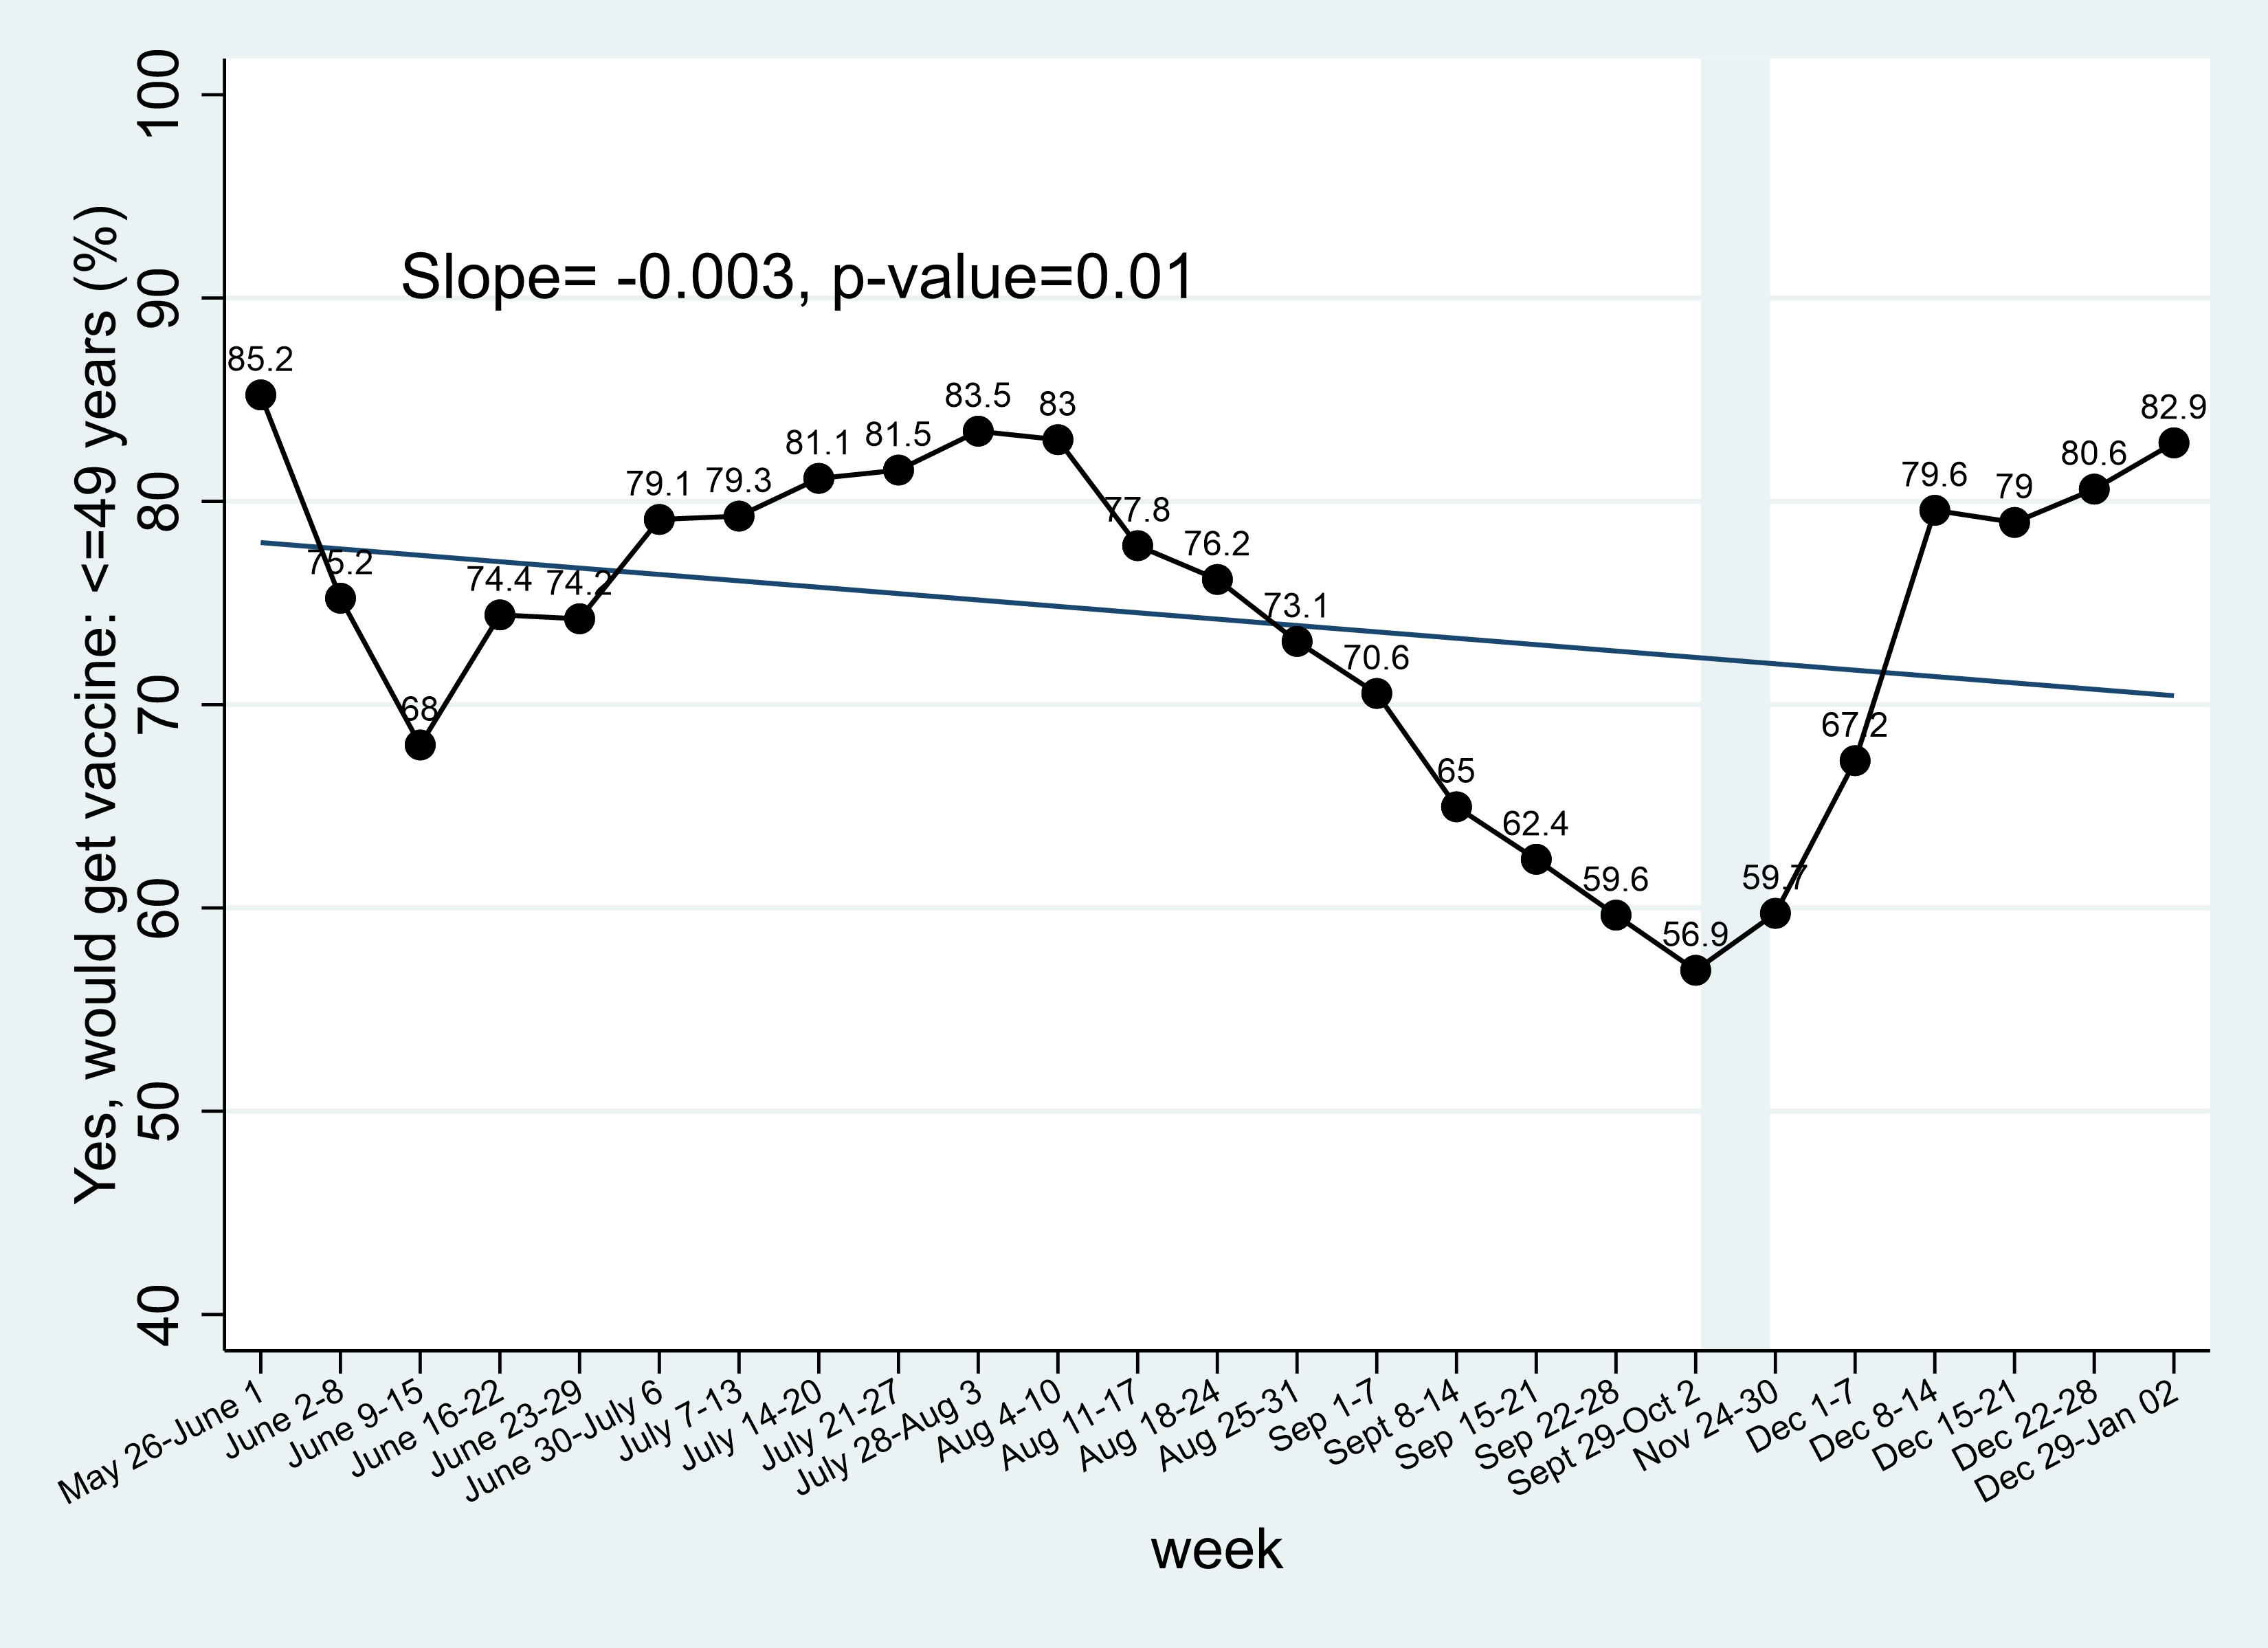
Figure 4b. Vaccine readiness – 50-64 years, Saskatchewan
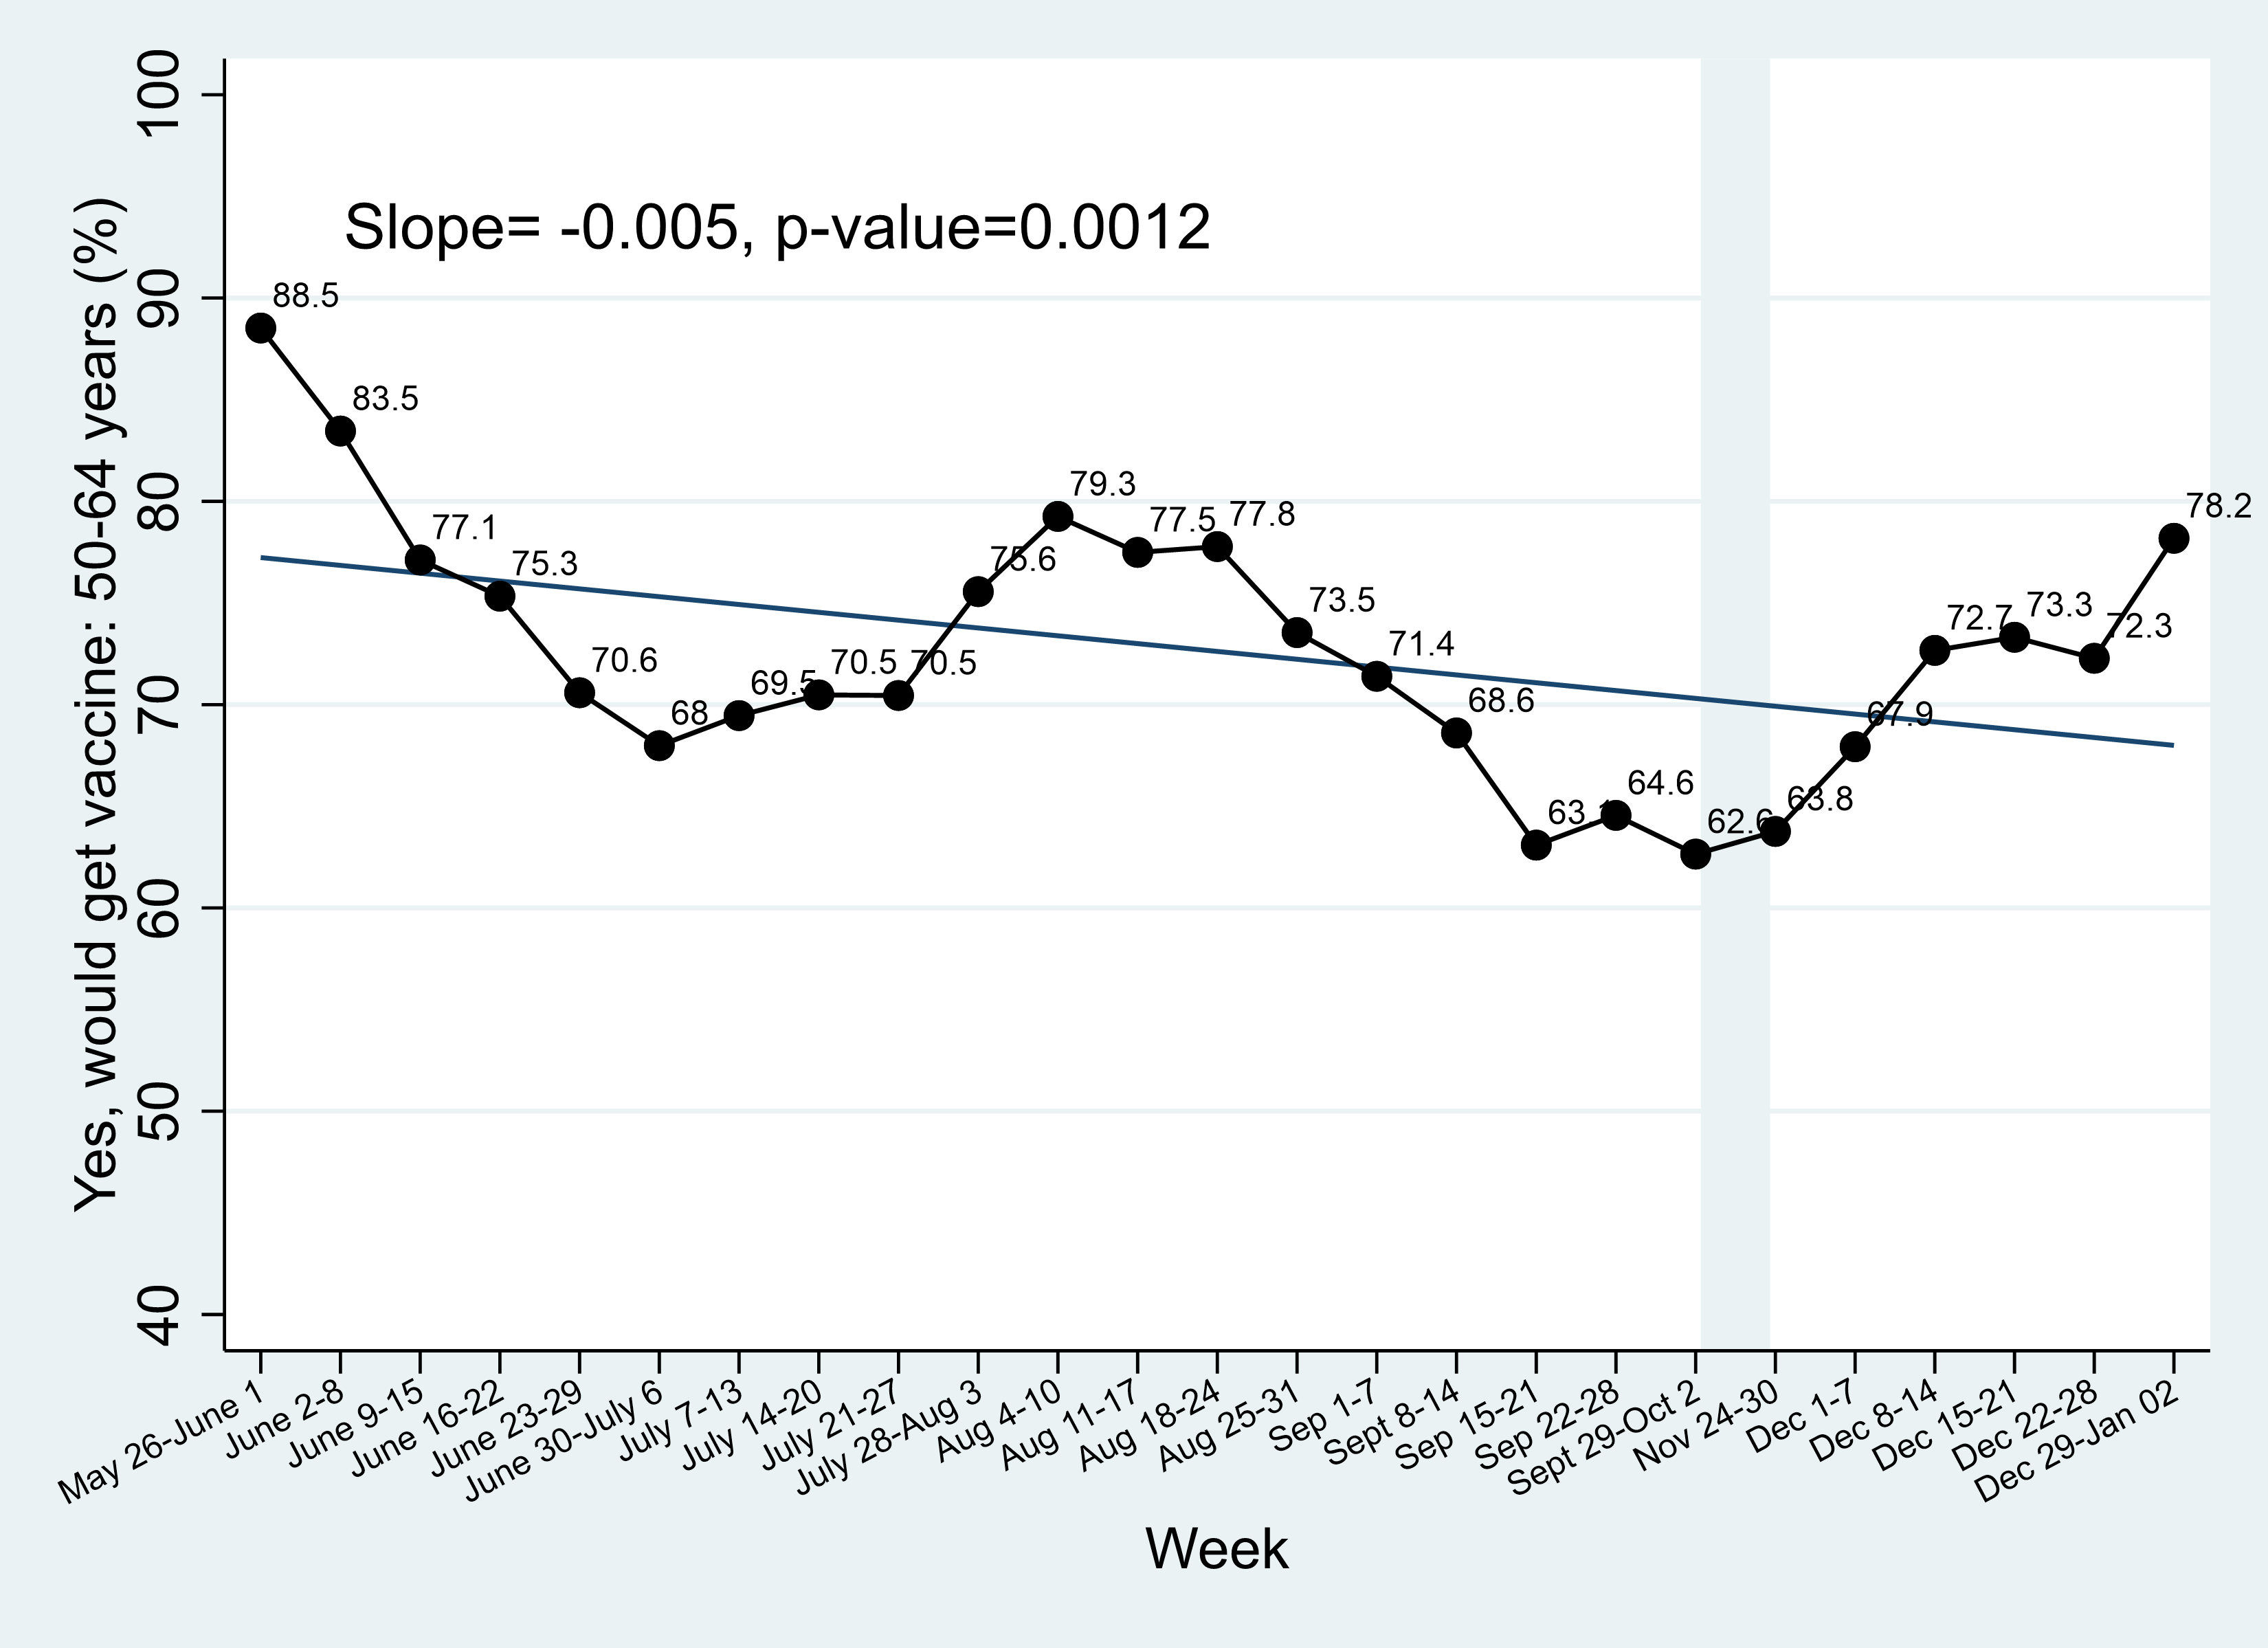
Figure 4c. Vaccine readiness – 65 years and older, Saskatchewan (the trend is not statistically significant)
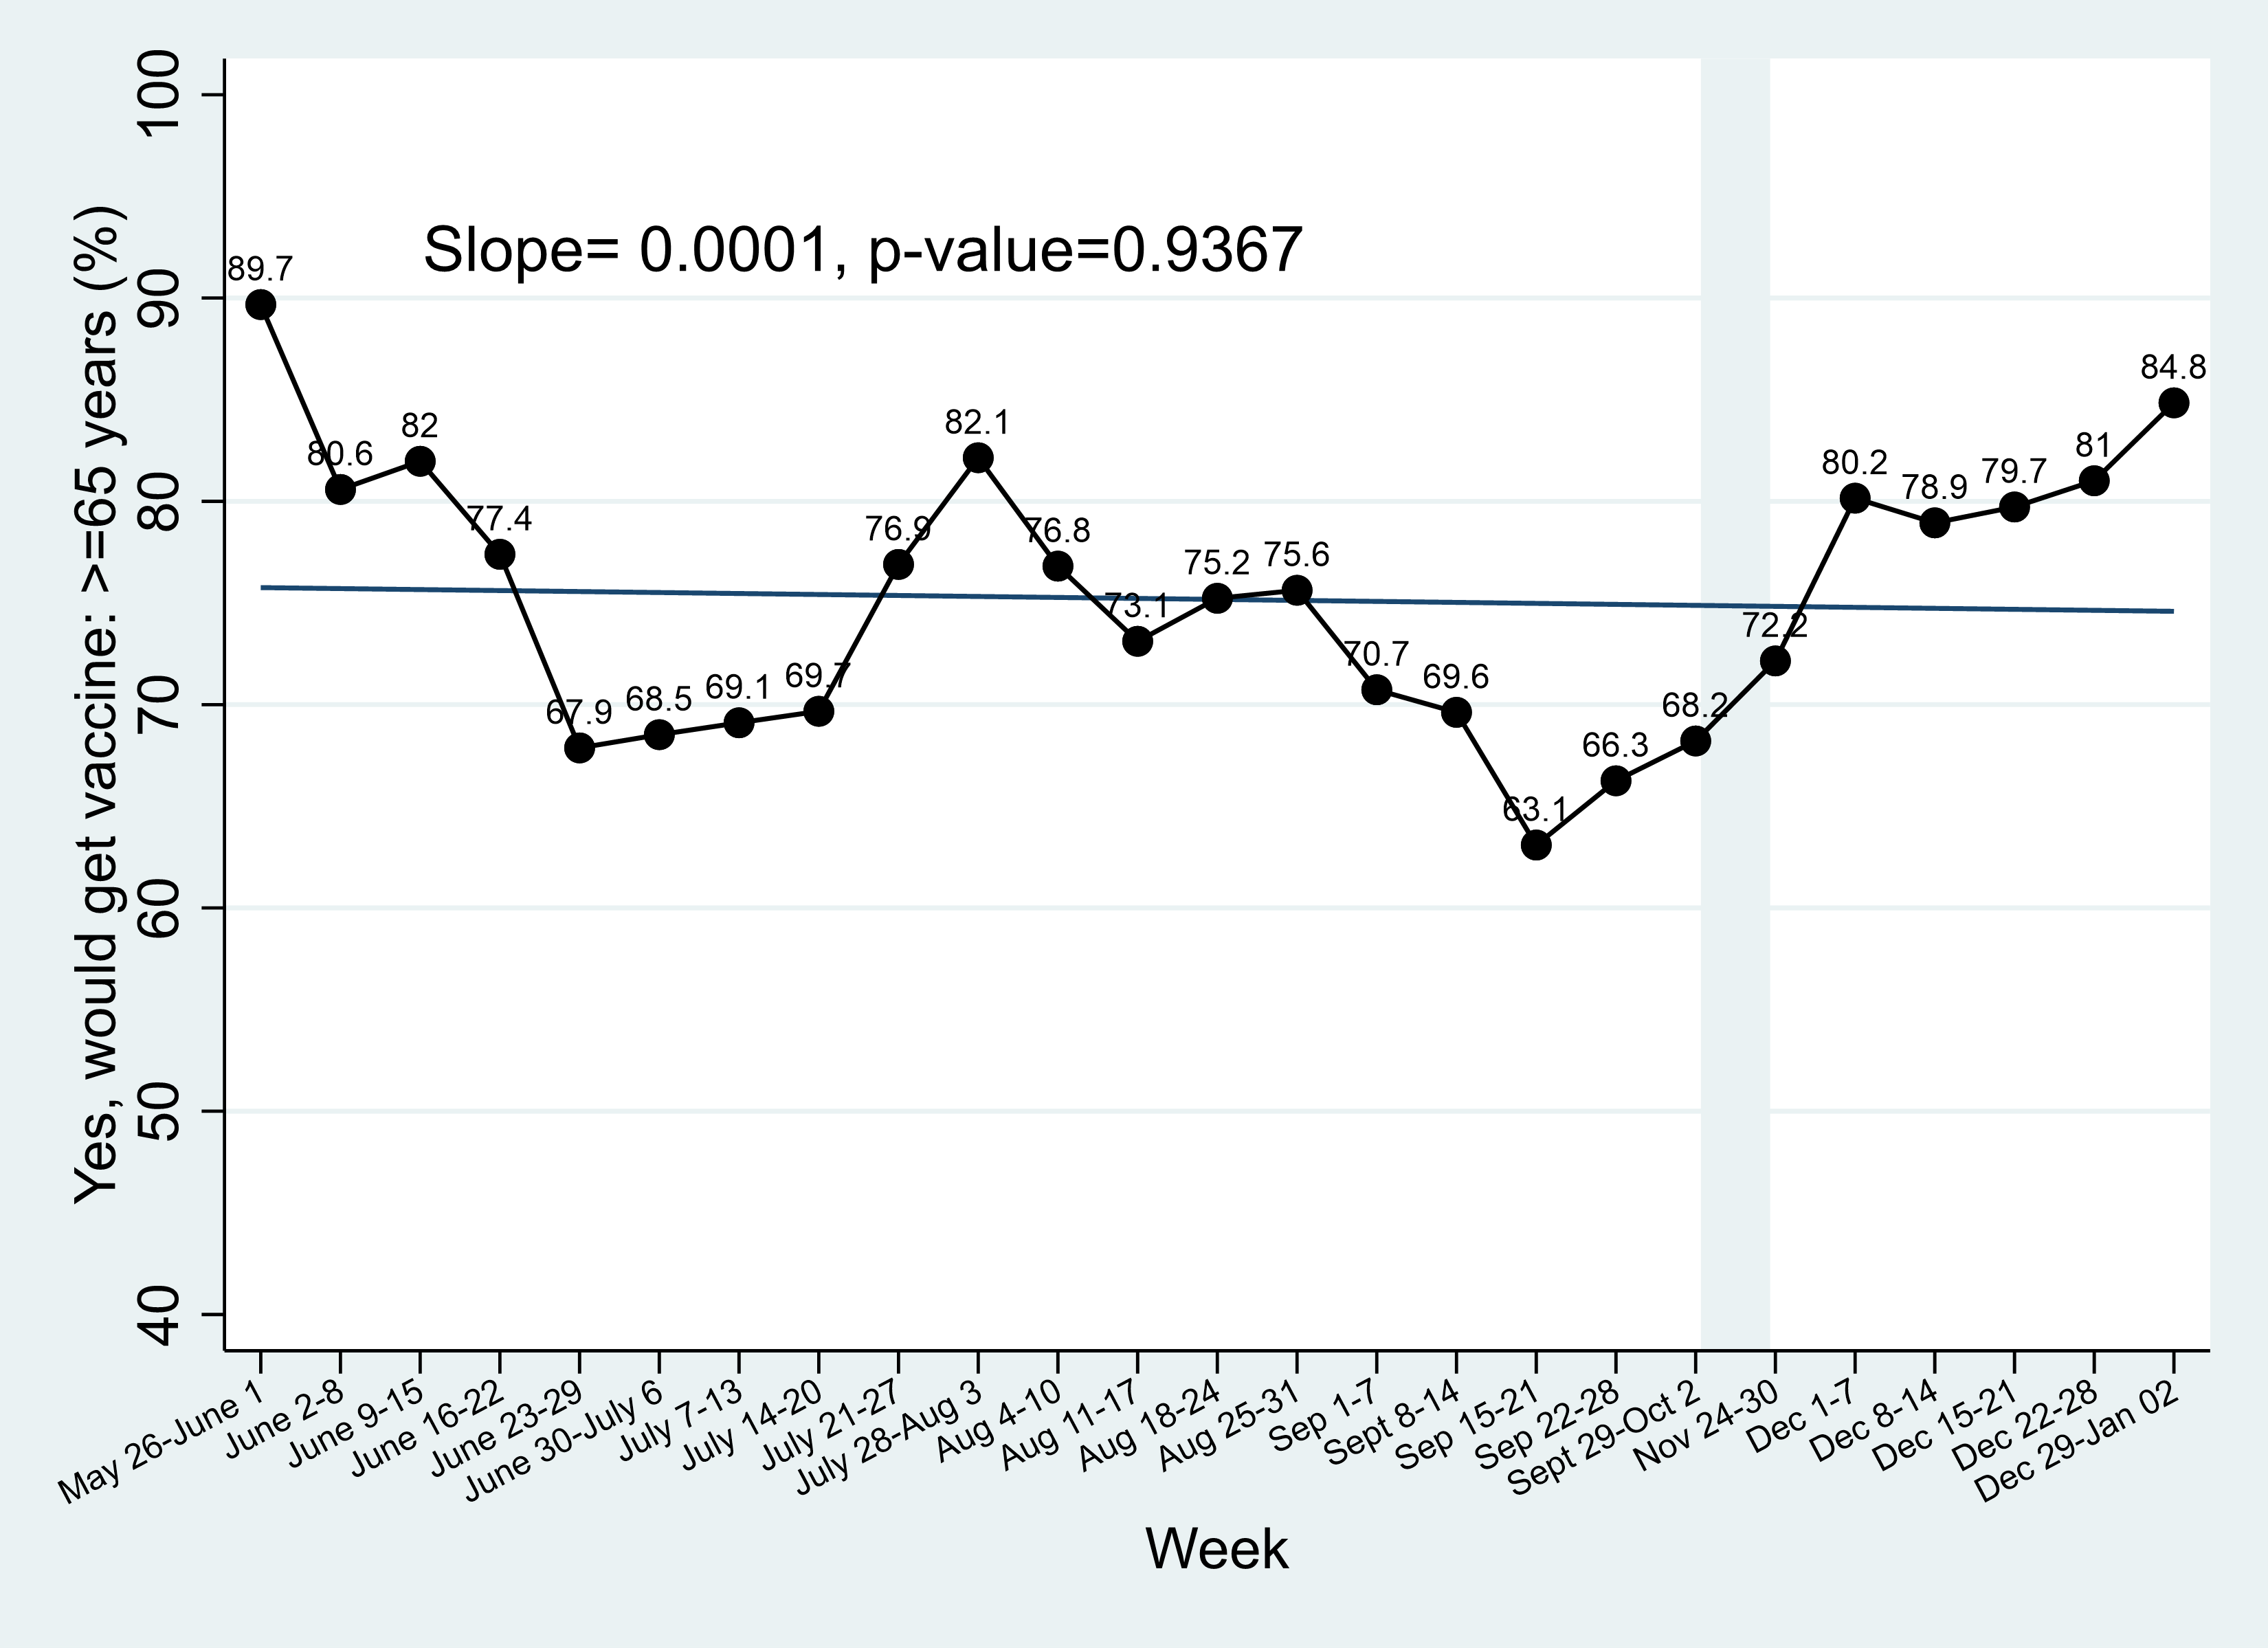
Figure 5a. Vaccine readiness – Rural, Saskatchewan (the trend is not statistically significant)
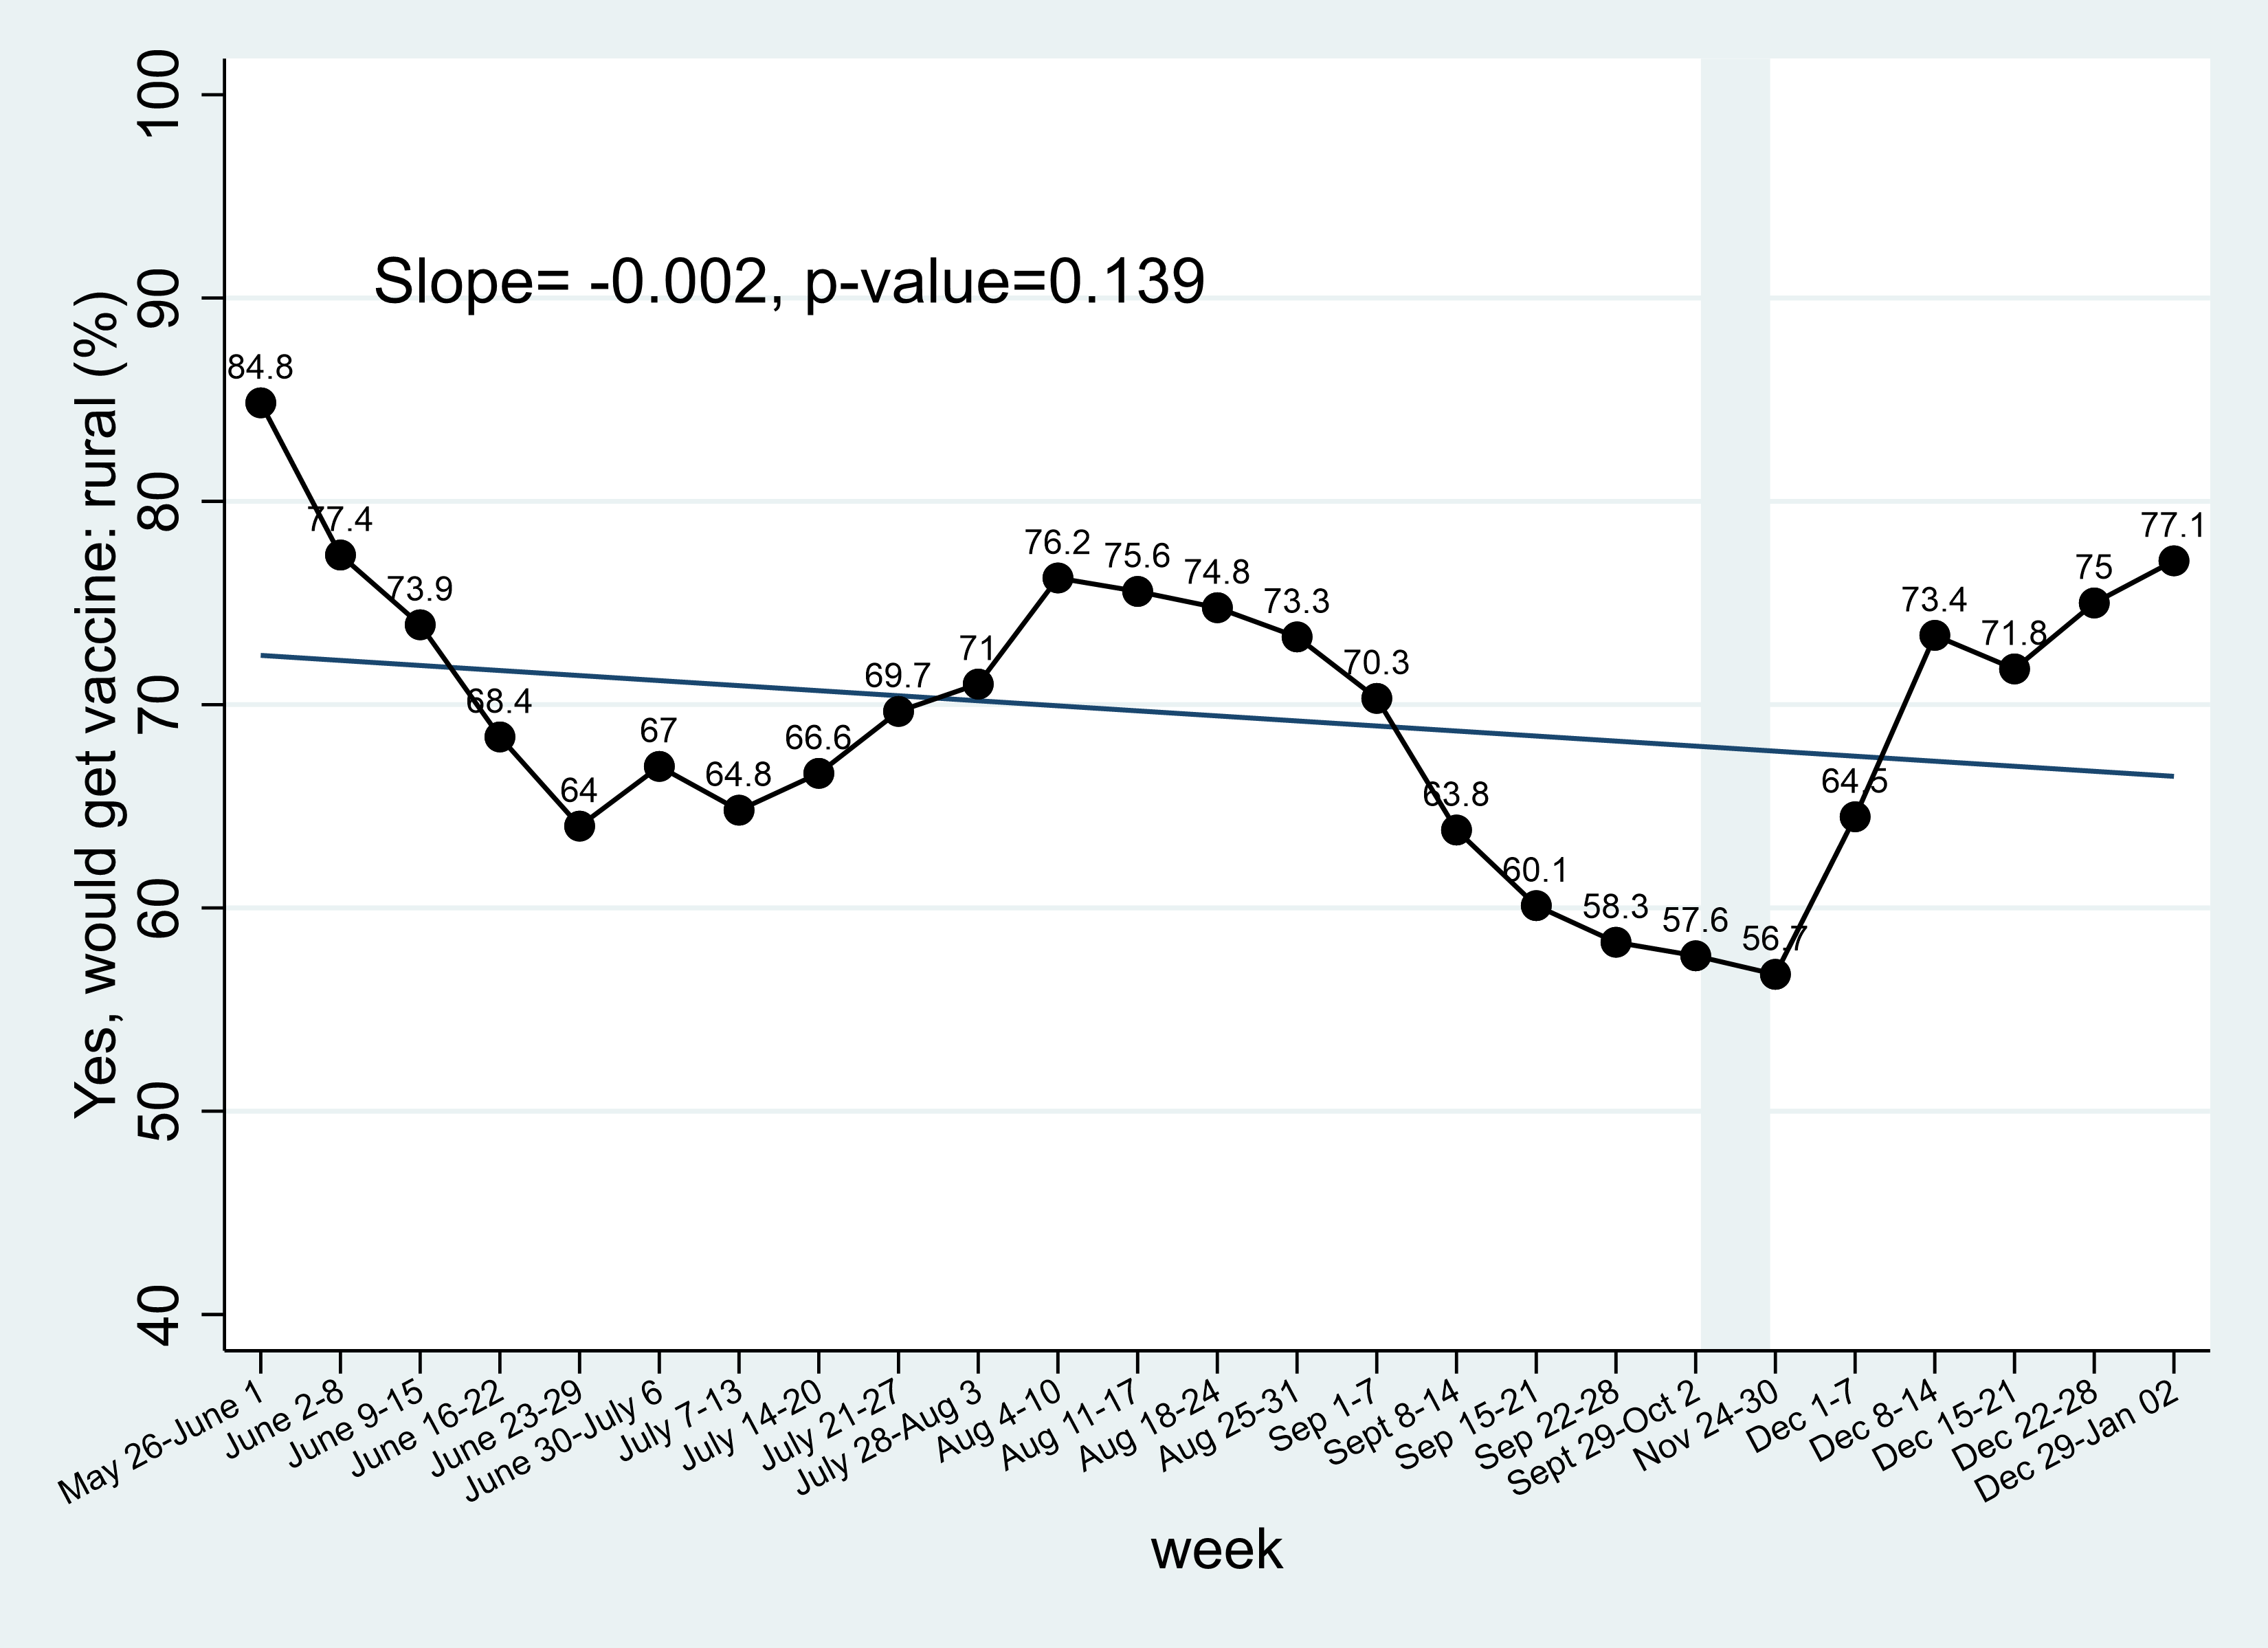
Figure 5b. Vaccine readiness – Mid-size cities/towns, Saskatchewan
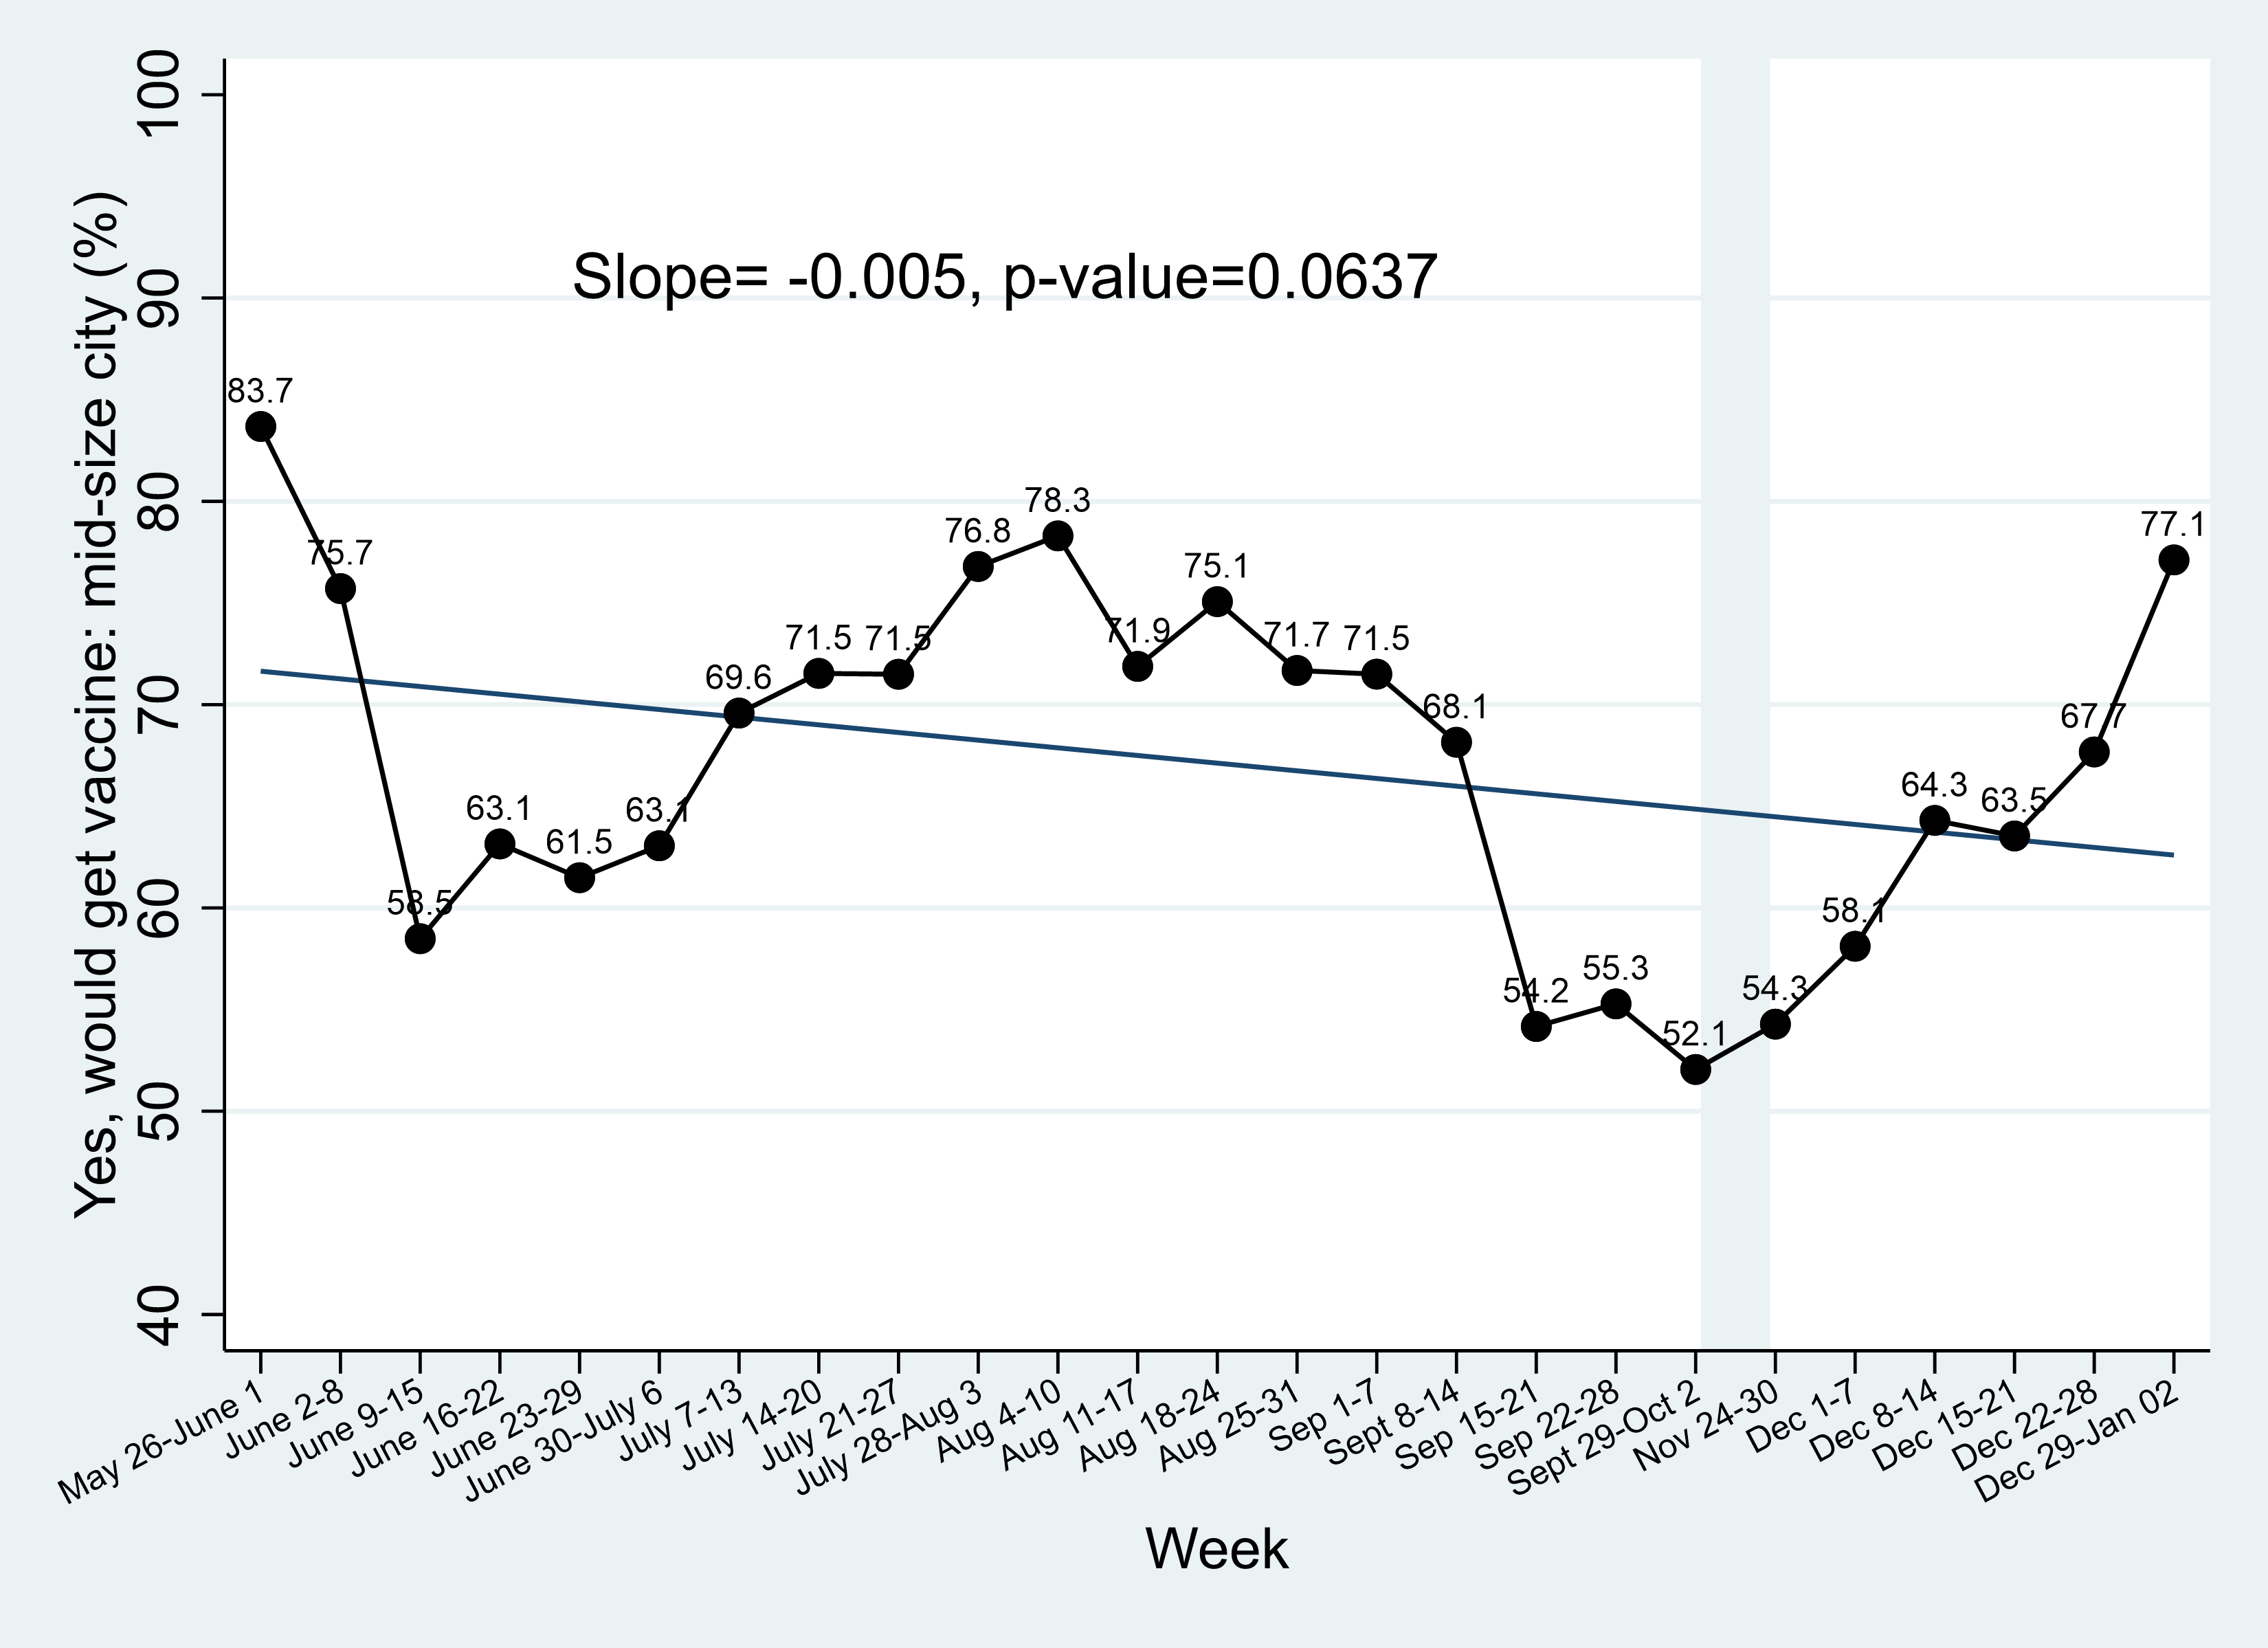
Figure 5c. Vaccine readiness – Regina
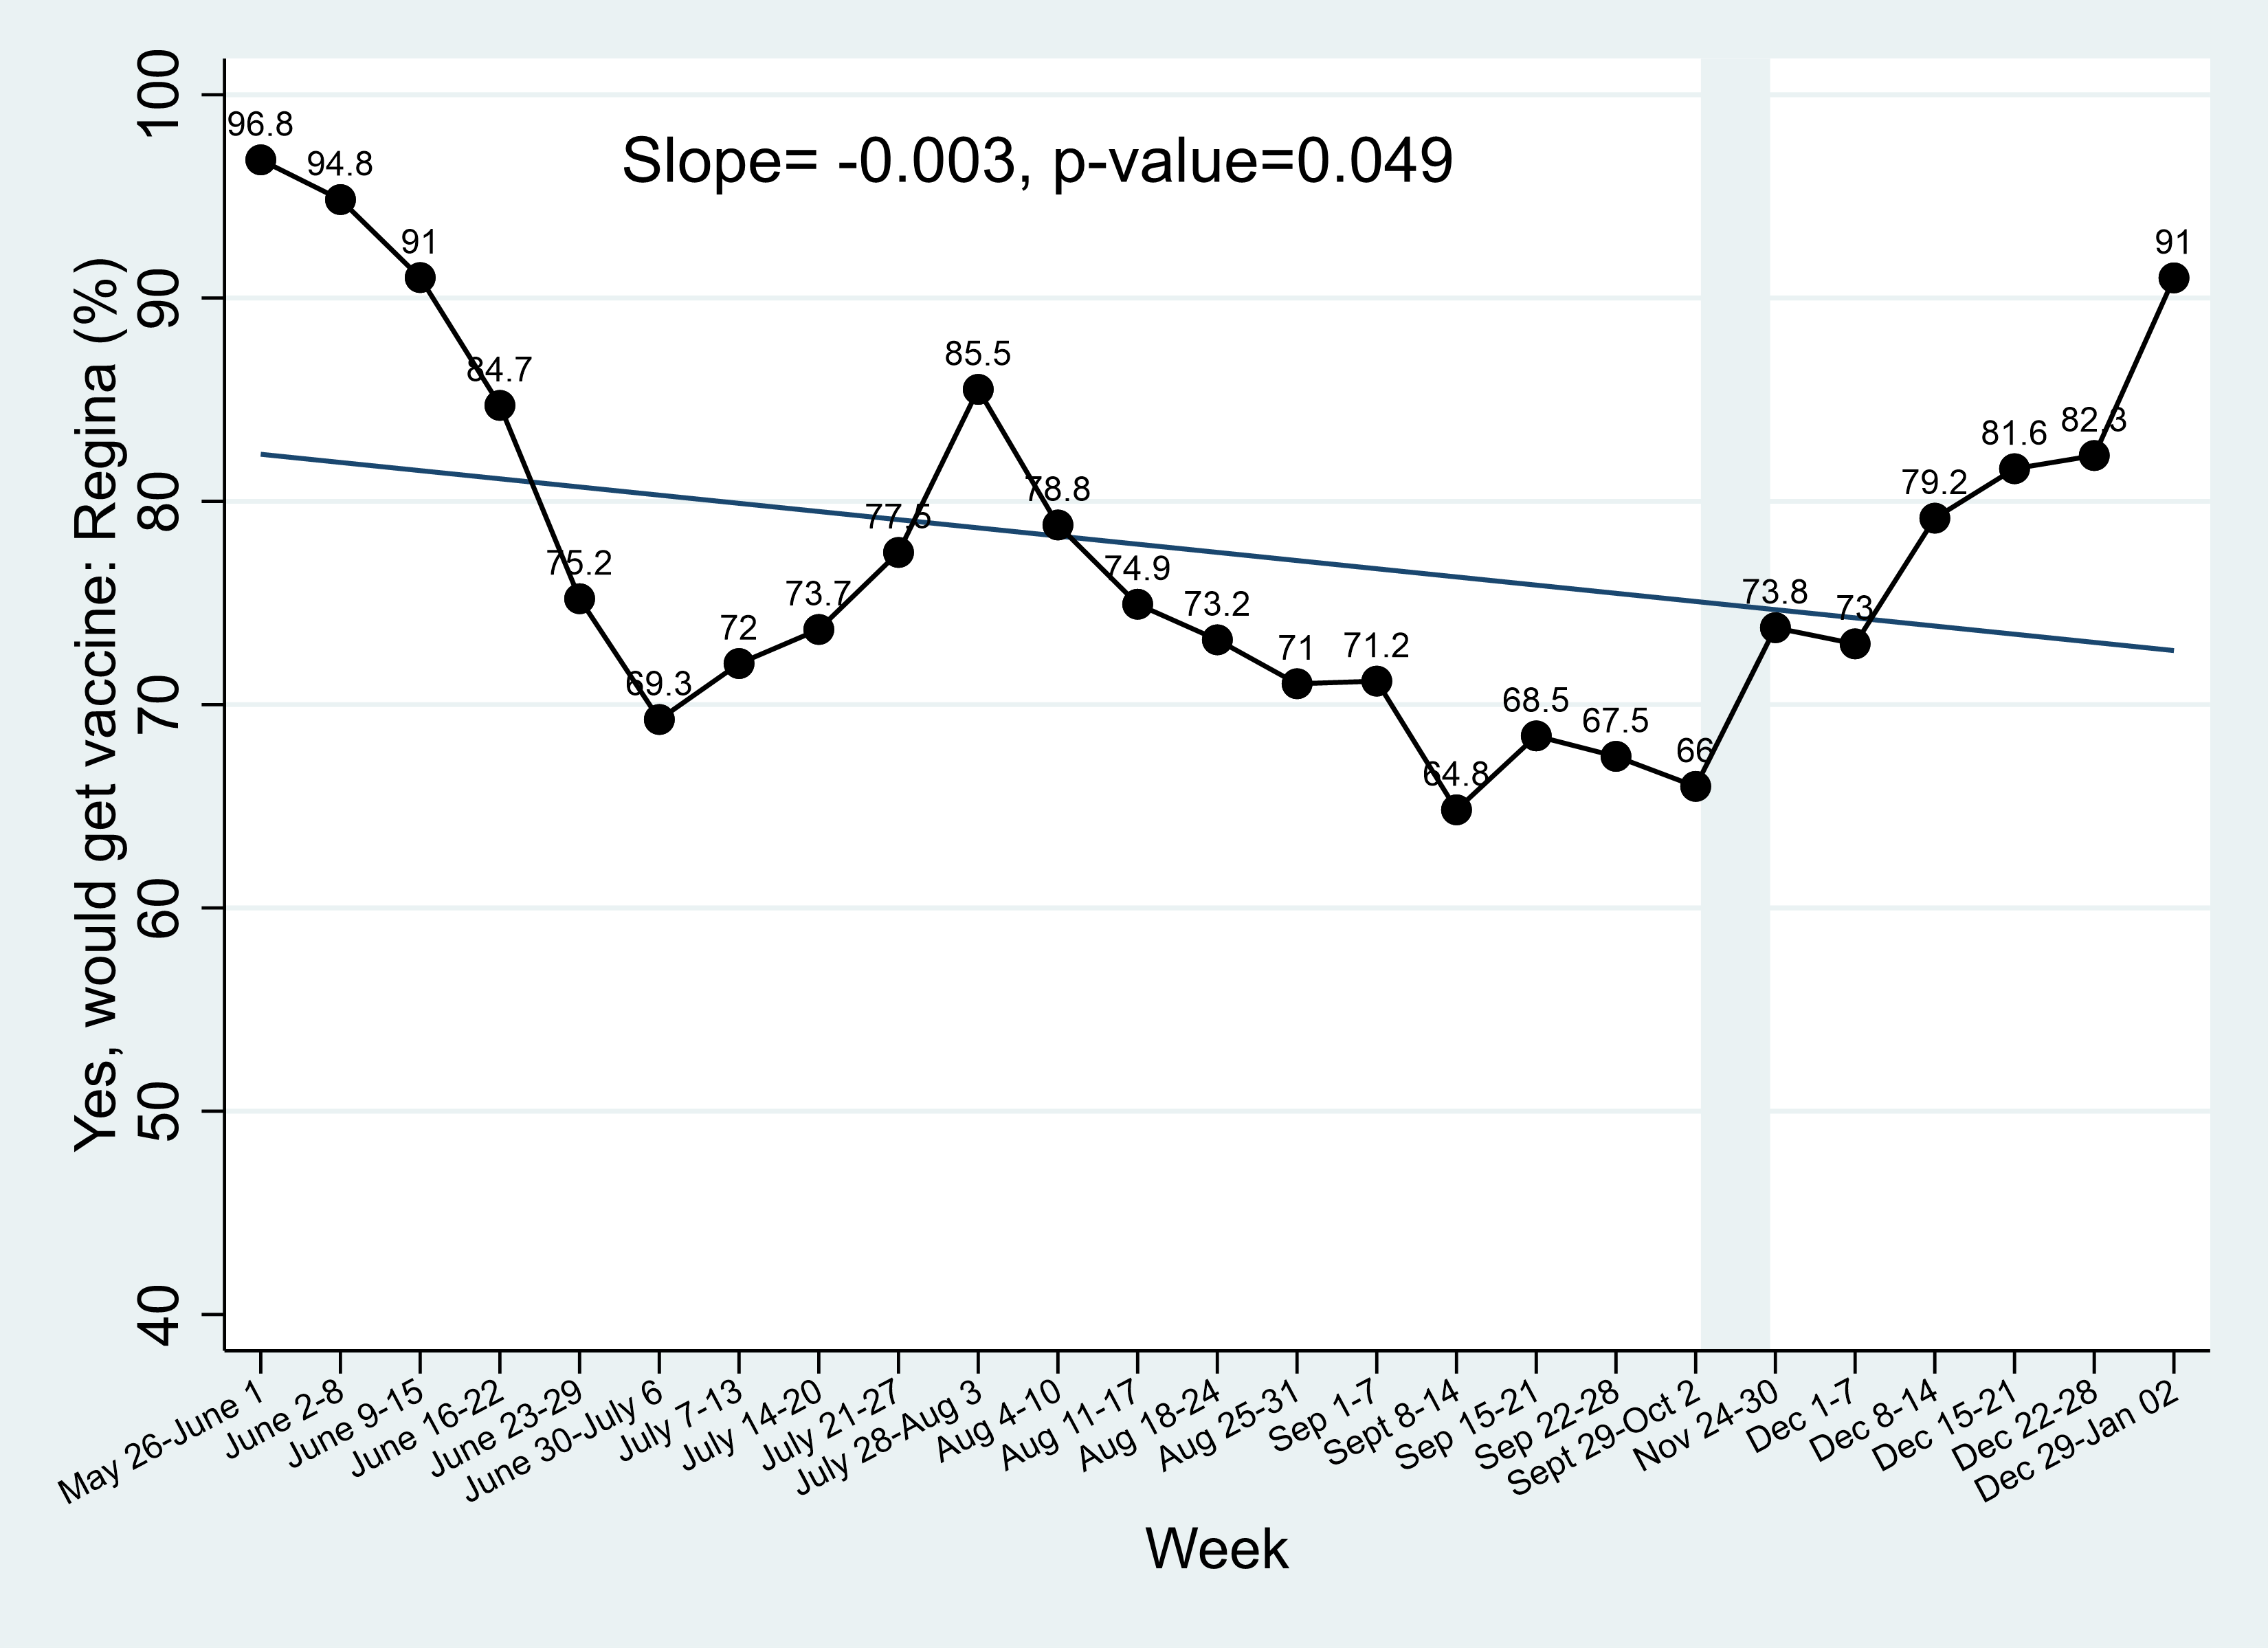
Figure 5d. Vaccine readiness – Saskatoon (trend not stat significant)
Part 2.
Who is refusing a vaccine or hesitant to get vaccines?
Vaccine refusal
Those who say they wouldn’t get a vaccine tend to be:
- Female, financially less secure and with less education (high school completion or completion of technical/vocational training).
- Newcomer, who have settled within last 20 years, or Indigenous.
- Not wearing masks consistently. This is a consistent pattern throughout the six months data were collected. And don’t consistently practice social distancing.
- Hardly concerned or only somewhat concerned (vs very concerned) about spreading the virus in the community.
They are less likely to:
- Be from Saskatoon (vs mid-size city).
- Report a high degree of risk of exposure to the virus at their workplace (vs low).
- Believe they would get very sick from COVID or die if they became infected (vs ‘will not get sick’).
- Believe the new coronavirus is a big threat to the community (vs small). This was a robust and consistent finding throughout the six months.
- Believe that people are not following government/public health orders.
Vaccine hesitancy
Those who say they don’t know whether they will get a vaccine tend to be:
- Have completed less education (high school completion or some college/university or completion of technical/vocational training vs professional training or university degree).
- Newcomer, who have settled within last 20 years, or Indigenous.
- Report having visited places in the last 7 days that may be deemed high or moderate risk for exposure (vs low).
They are less likely to:
- Report that their health is generally excellent or very good (vs fair or poor).
- Believe they would get a mild/moderate or very sick from COVID if they became infected (vs ‘will not get sick’).
- Believe the new coronavirus is a ‘big’ threat to the community (vs small). This has been a consistent finding over the last four months.
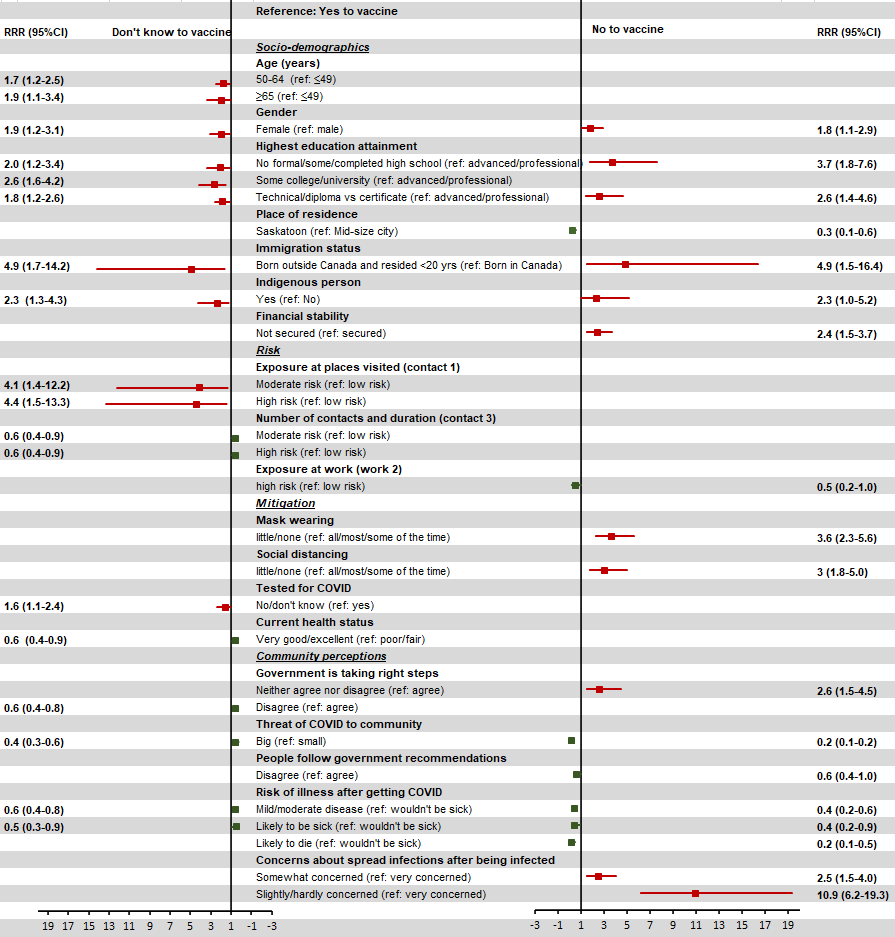
The Forest Plot below displays the statistically significant attributes of those who said they will not get a vaccine (vaccine refusals) or were not sure about getting a vaccine (vaccine hesitancy). The data come from the Social Contours study, omnibus sample (n=3219), Saskatchewan, collected from June to December 2020, and is based on a multinomial logistic regression analysis, i.e. two or more outcomes compared to reference outcome.
Note about how to understand the Forest Plot: Two sets of results are presented, refusals (compared to ‘vaccine-ready’) on the right panel and hesitants (compared to vaccine-ready) on the left. In the middle panel are attributes that are statistically significant for either set of results, classified by sociodemographic, risk, mitigation and community perceptions. The estimates are visually shown in the colour-coded lines, red indicating it favours the vaccine refusals or hesitant outcome, green indicating that it favours the opposite, i.e. vaccine-ready. The actual estimates, RRR for relative risk ratios, are displayed in numbers as well with their 95% confidence intervals.
Citation:
Nazeem Muhajarine and Social Contours study team. Social Contours and COVID-19: Using metrics and data to guide pandemic response. Saskatchewan Population Health and Evaluation Research Unit (SPHERU). January 9, 2021.
_______________________________
Data below are based on Social Contours and COVID-19 study; as of March 2, 2021, this includes n=8,790 (where otherwise indicated), results are age-gender-location of residence weighted (Census 2016, Saskatchewan adult population) and data are 4-week moving averages when time trends are presented.
Risk Map of Saskatchewan
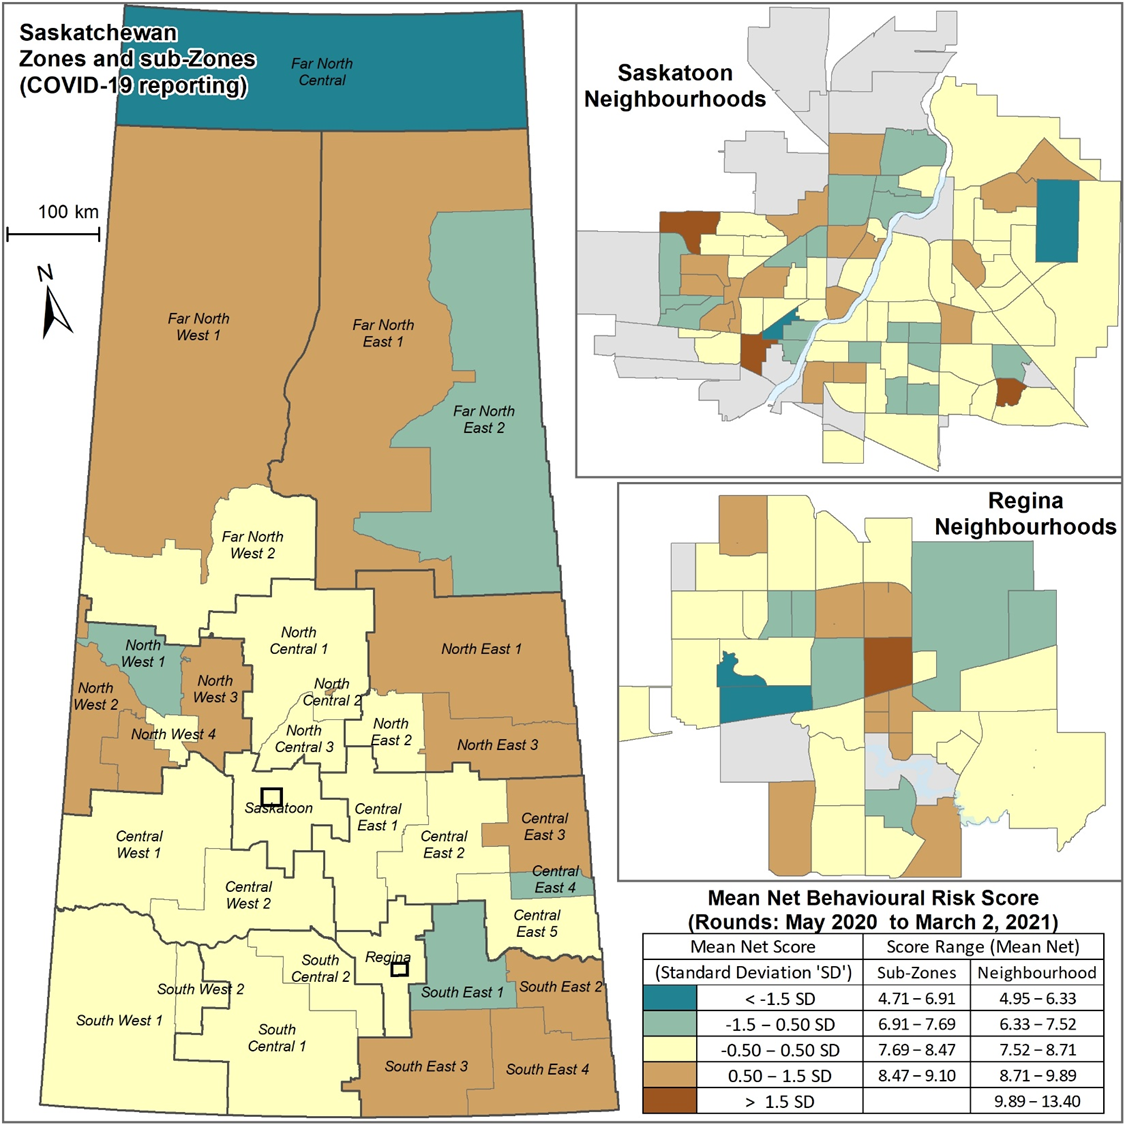
Figure 1. Behavioural Risk Score by Saskatchewan Zones and Sub-Zones, Social Contours and COVID-19 study, Rounds 1-8, n=8790.
Contact intensity by neighbourhoods in Regina
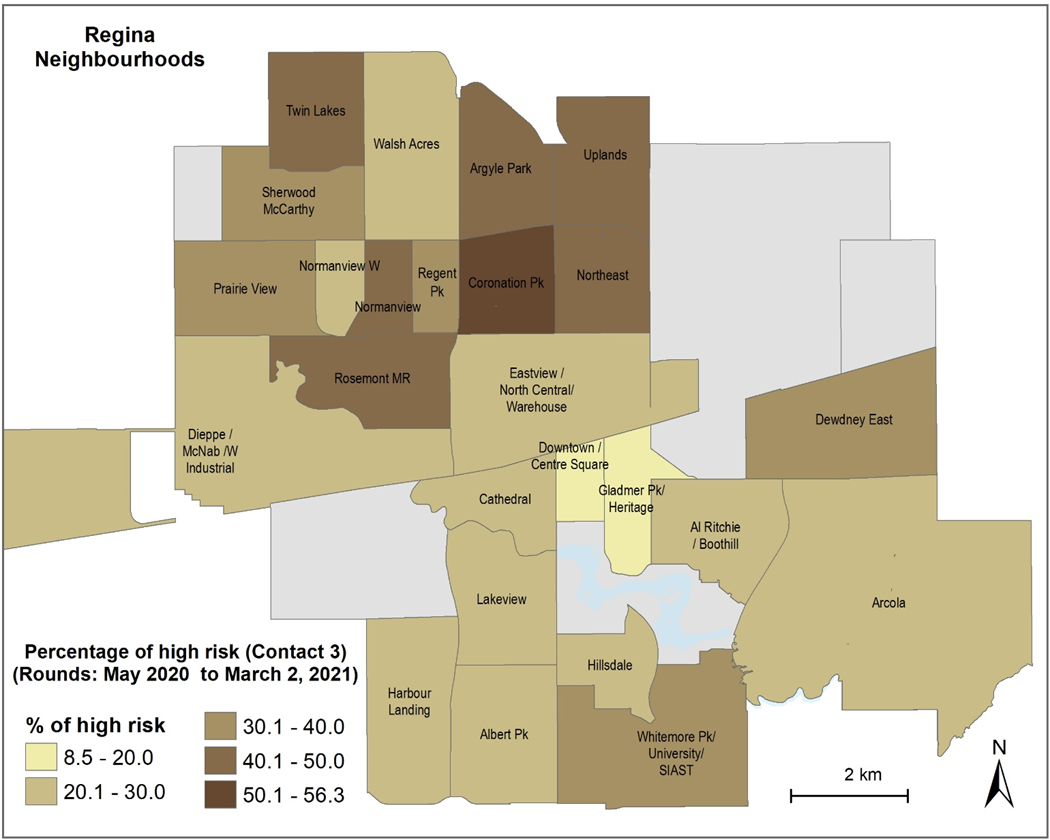
This ‘neighbourhood’ map of Regina shows areas of high risk for contact intensity—the darker the colour, higher the risk.
- Risk Exposure and Behaviours
- Risk Mitigation
- Perceptions: Pandemic Response and Risk
- Vaccines
- Mapping Risk in Saskatchewan
- Masks
- School and Parenting
- Results by Round (1-3)
1. Risk Exposure and Behaviours
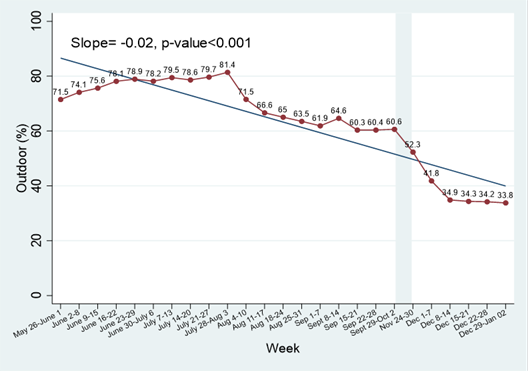
Visiting a public park or outdoor/nature, last 7 days (May 26, 2020 to January 2, 2021)
TRENDS
Risk Behaviour - Shopping for food (May 4-September 2020)
3-week moving averages, weighted data, Regression of p=high/[high+low&moderate] on week: Slope = 0.00774, std. error = 0.00112, Z = 6.904
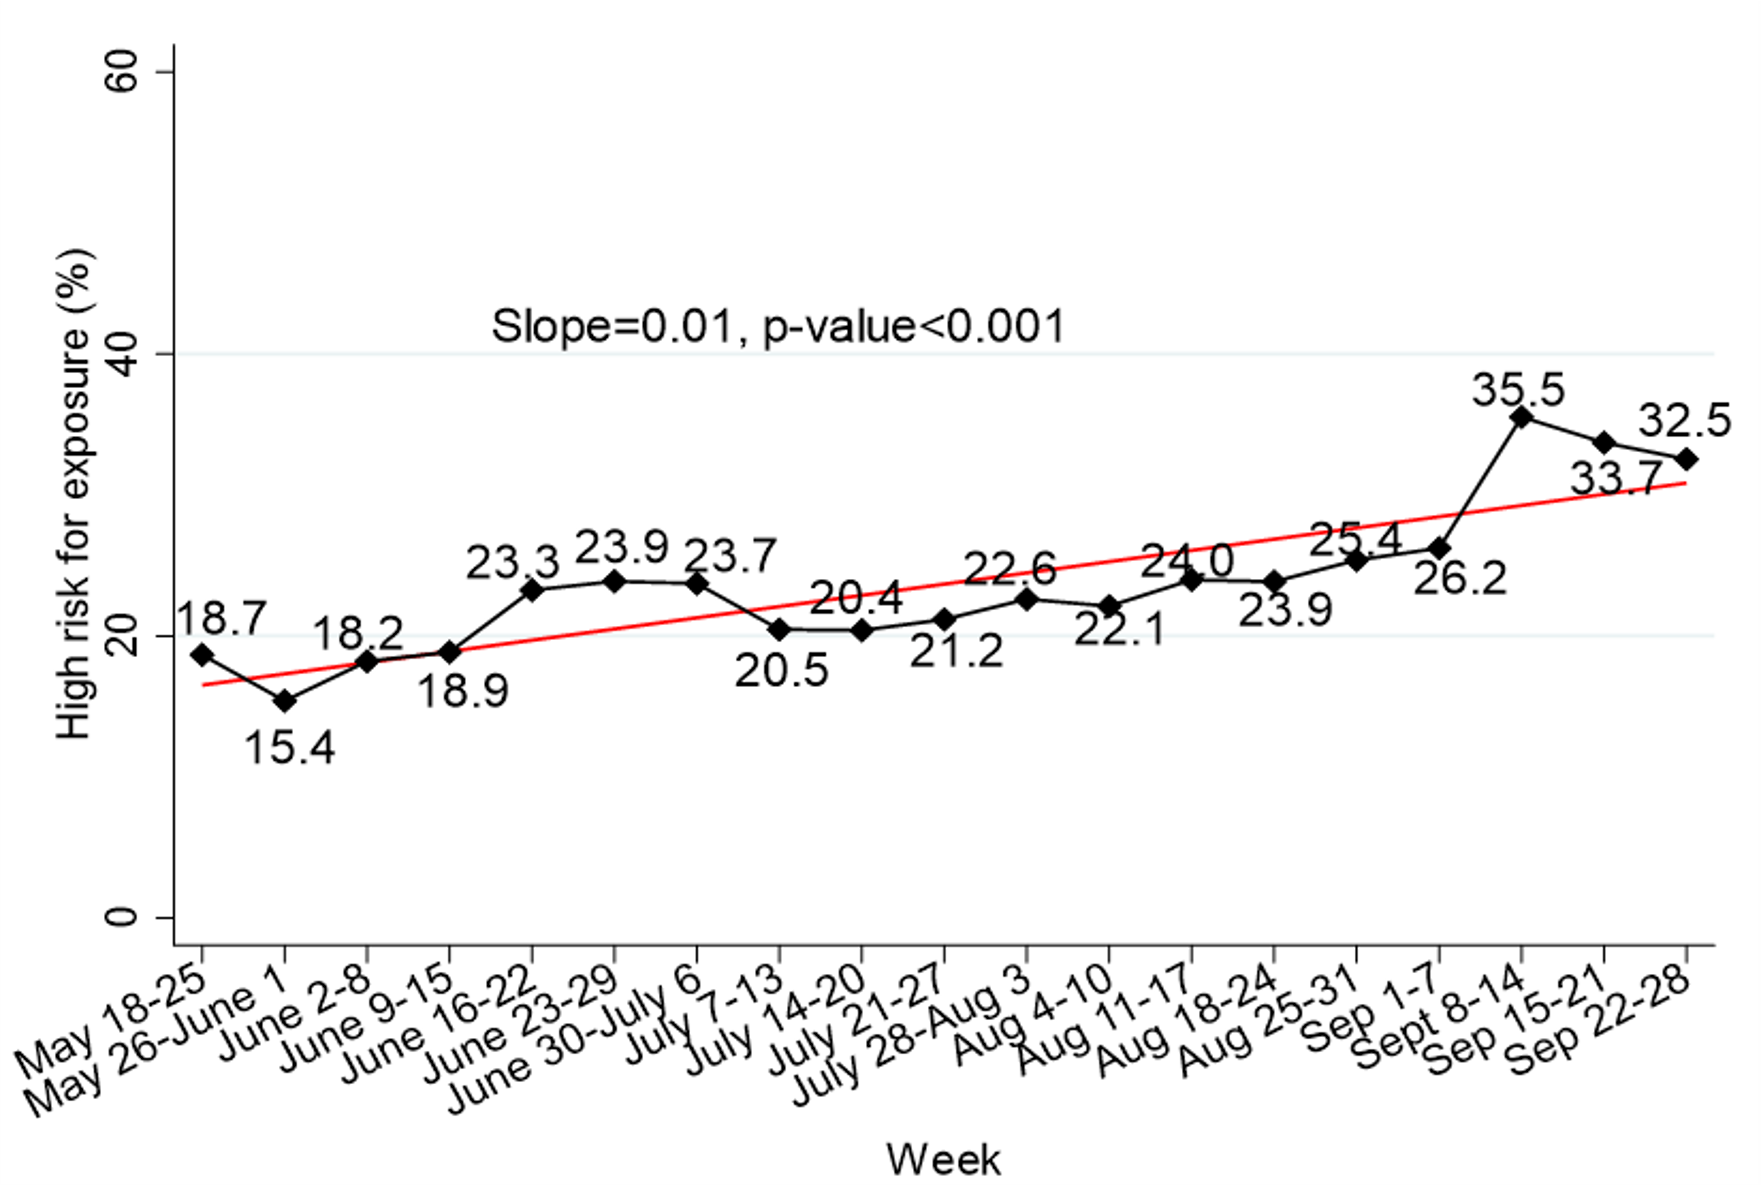
OVERALL RISK EXPOSURE
May 26, 2020 to January 2, 2021
based on a cumulative score of 10 variables—percent ‘high” risk for exposure
Data based on Social Contours and COVID-19 longitudinal panel study; as of Jan 2, 2021 n=7015, age-gender-location of residence weighted (Census 2016) and data are 4-week moving averages.
(back to previously reported results menu)
2. Risk Mitigation
Previous Results (May-September 2020)
How have mitigation behaviours changed over time?
Trends: Overall Mitigation
6 MITIGATION BEHAVIOURS
(1) mitigation if suspected infection (2) handwashing frequency (3) social distancing
(4) not touching face (5) wearing a mask (6) personal protective equipment
![3-week moving averages, weighted data, Regression of p=high/[high+low&moderate] on week: Slope = -0.00751 std. error = 0.0013 Z = 5.782](https://spheru.ca/covid-19/socialcontours/sc_overallmitigation_maytosept_trends.png)
3-week moving averages, weighted data, Regression of p=high/[high+low&moderate] on week: Slope = -0.00751 std. error = 0.0013 Z = 5.782
Trends: Mitigation
SOCIAL DISTANCING
3-week moving averages, weighted data, Regression of p=high/[high+low&moderate] on week: Slope = -0.00563, std. error = 0.00144, Z= 3.897
Trends: Mitigation
FACE-MASKING
3-week moving averages, weighted data, Regression of p=high/[high+low&moderate] on week: Slope = 0.01829 std. error = 0.0017Z = 10.647
(back to previously reported results menu)
3. Perceptions: Pandemic Response and Risk
TRENDS: Perceptions of risk changed over time (May-September 2020)
PERCEPTION OF RISK
those who say likely to 'get very sick or die' if infected
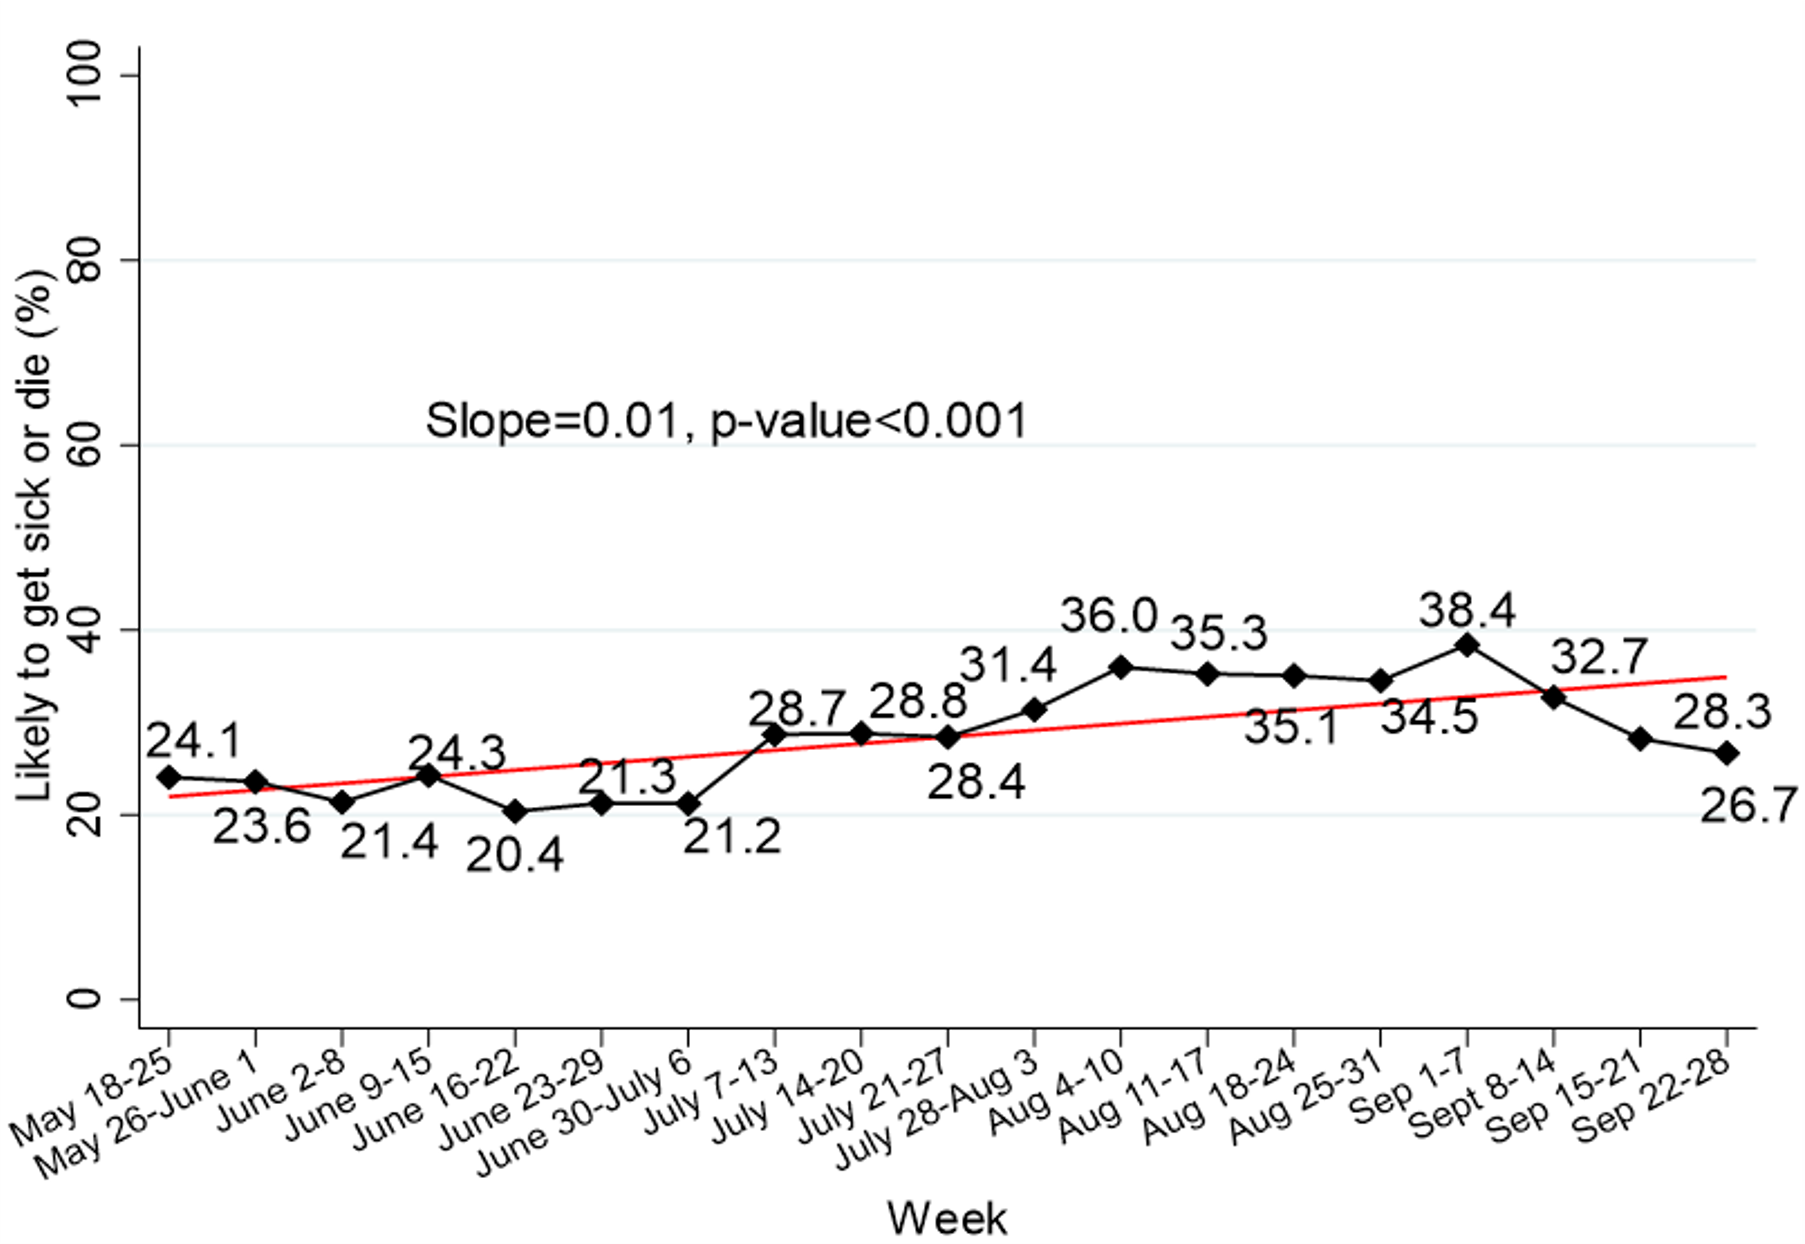
3-week moving average, weighted data, Regression of p=high/[high+low&moderate] on week: Slope = 0.00669, std. error = 0.00116, Z = 5.750
PERCEPTION OF RISK
those who say very concerned about spreading the virus
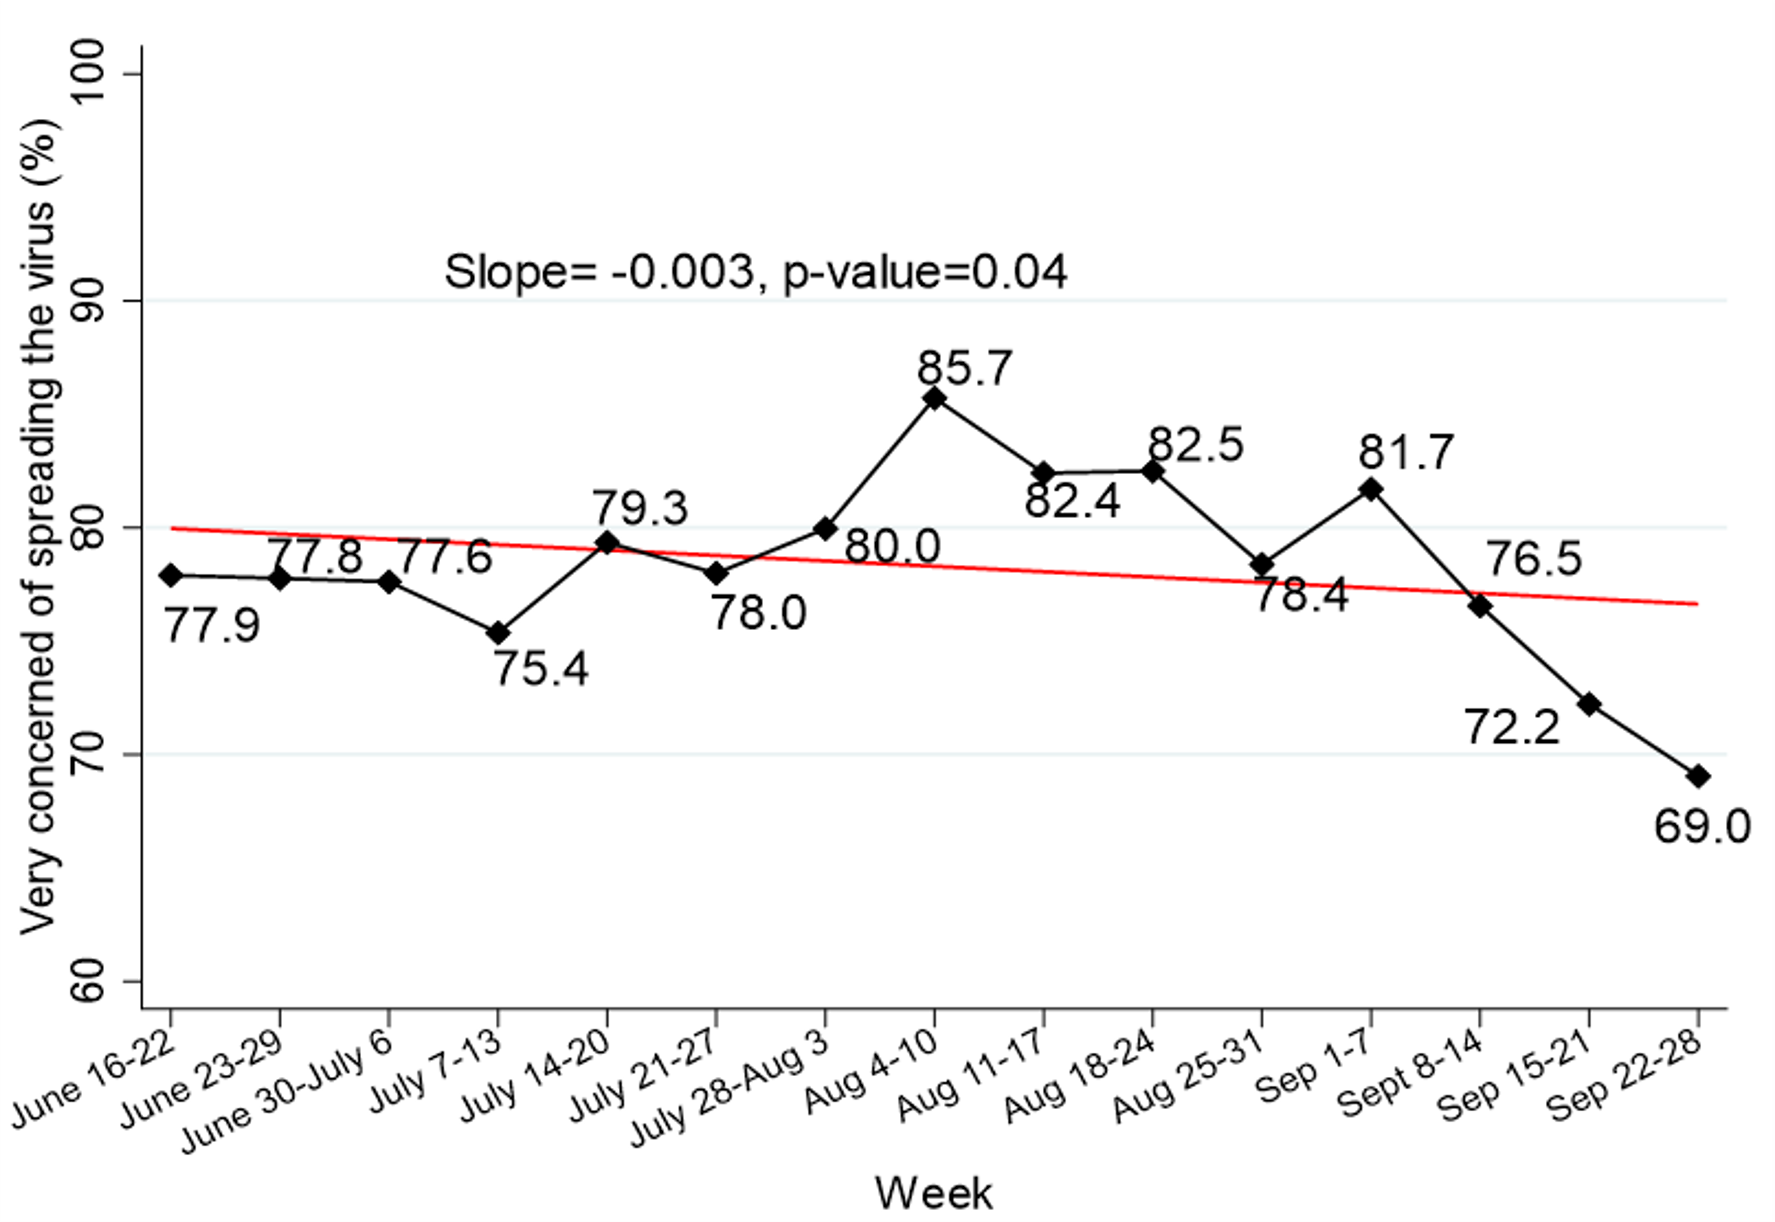
3-week moving average, weighted data, Regression of p=high/[high+low&moderate] on week: Slope = -0.00295 std. error = 0.00143, Z = 2.062
PERCEPTION OF RISK
those who say Coronavirus is a ‘big threat’ to the health of community
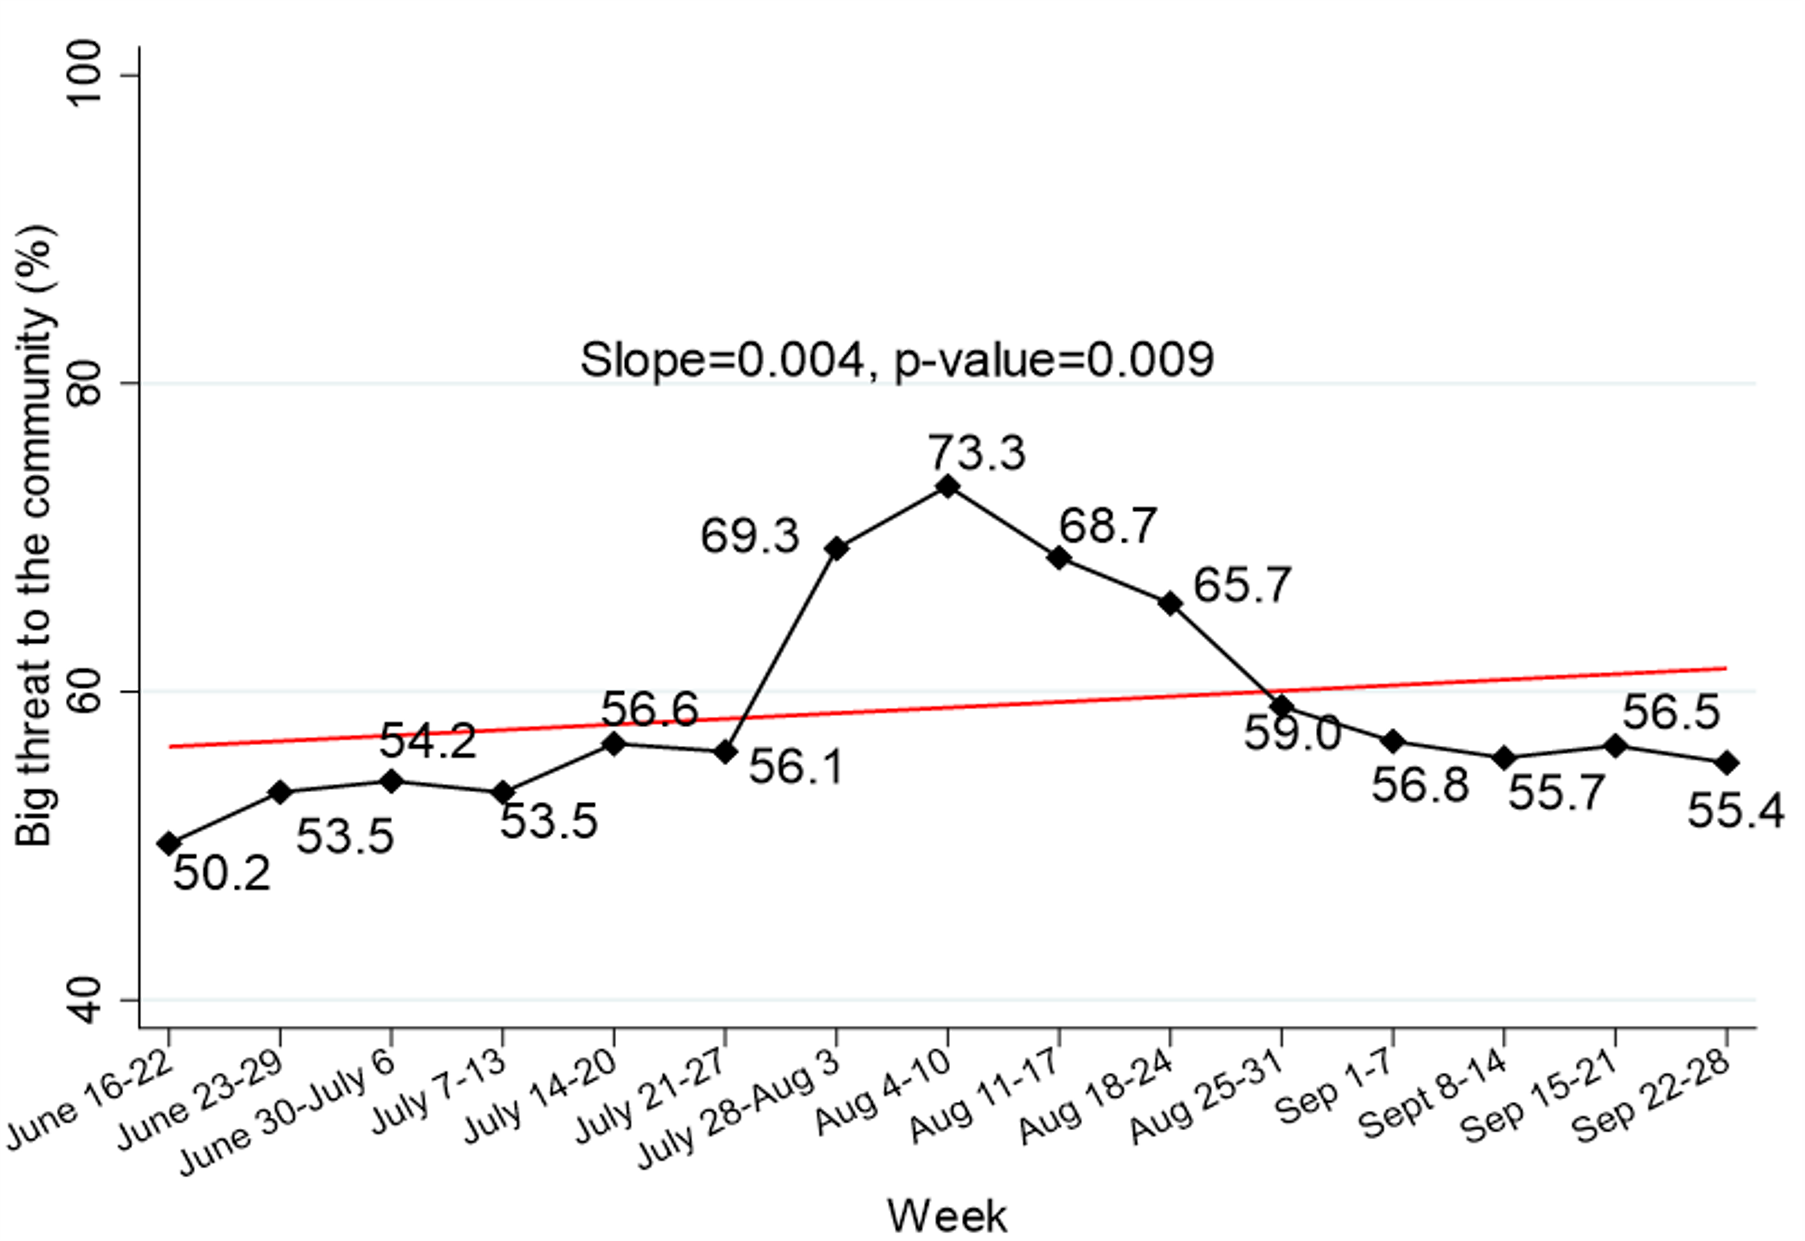
3-week moving average, weighted data, Regression of p=high/[high+low&moderate] on week: Slope = 0.00441, std. error = 0.0017, Z = 2.600
PERCEPTION OF RISK
those who say people are taking precautions
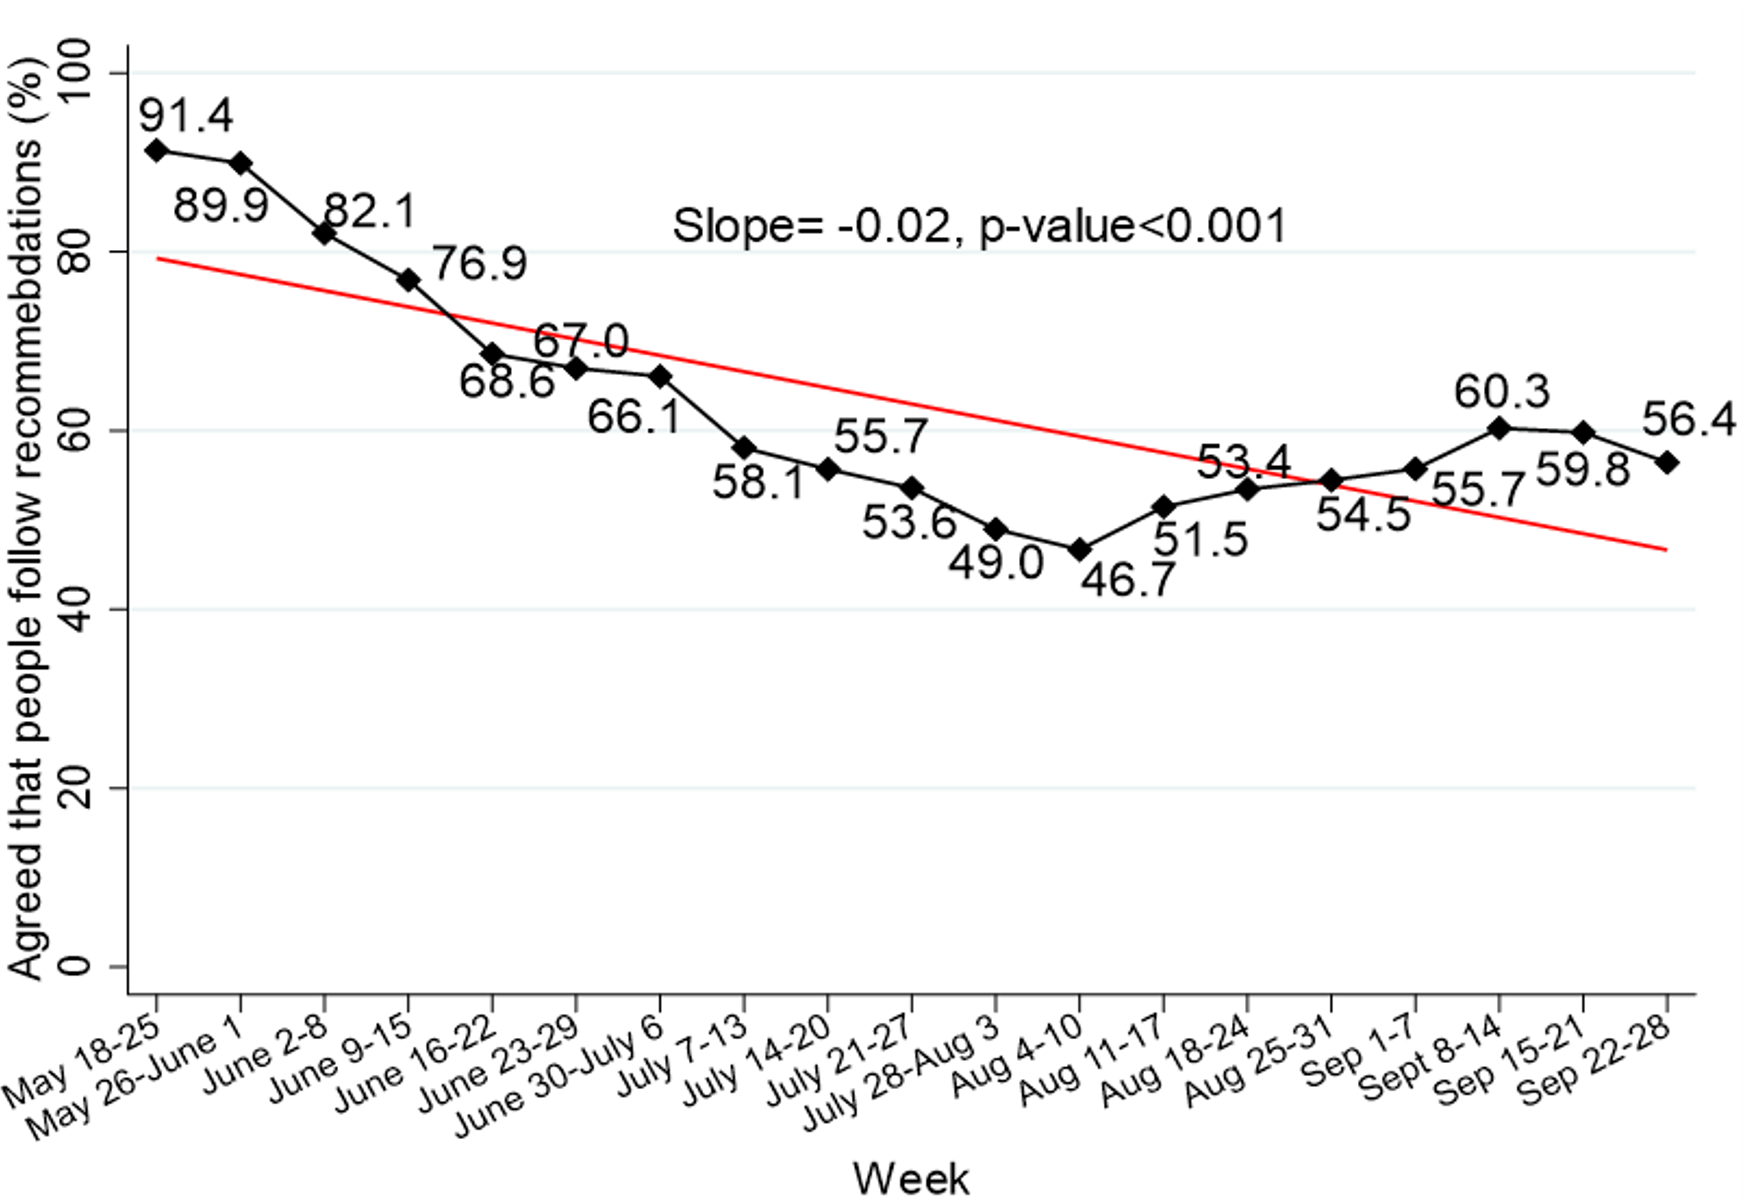
3-week moving average, weighted data, Regression of p=high/[high+low&moderate] on week: Slope = -0.01737, std. error = 0.00131, Z = 13.293
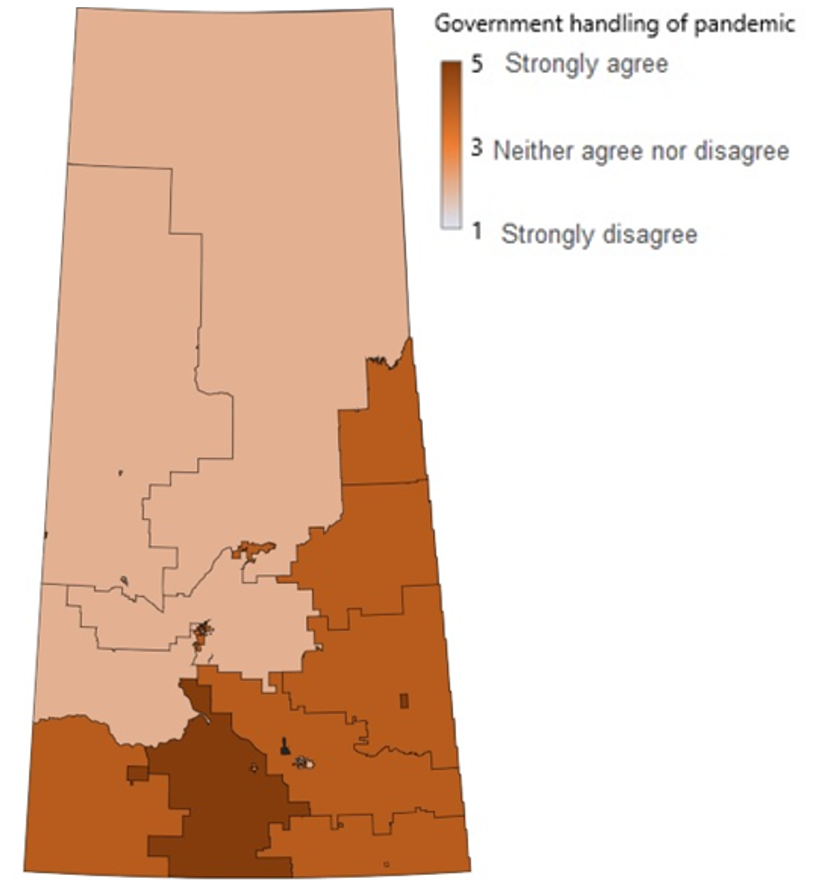
PERCEPTION OF RISK
those who say government is handling the pandemic well
3-week moving average, weighted data, Regression of p=high/[high+low&moderate] on week: Slope = -0.01885, std. error = 0.00132, Z = 14.299
At this stage of the pandemic, my government is taking the steps needed to stop the spread of the virus.
Round 5 - September 2020
PERCEPTION OF RISK
those who say government is handling the pandemic well, by gender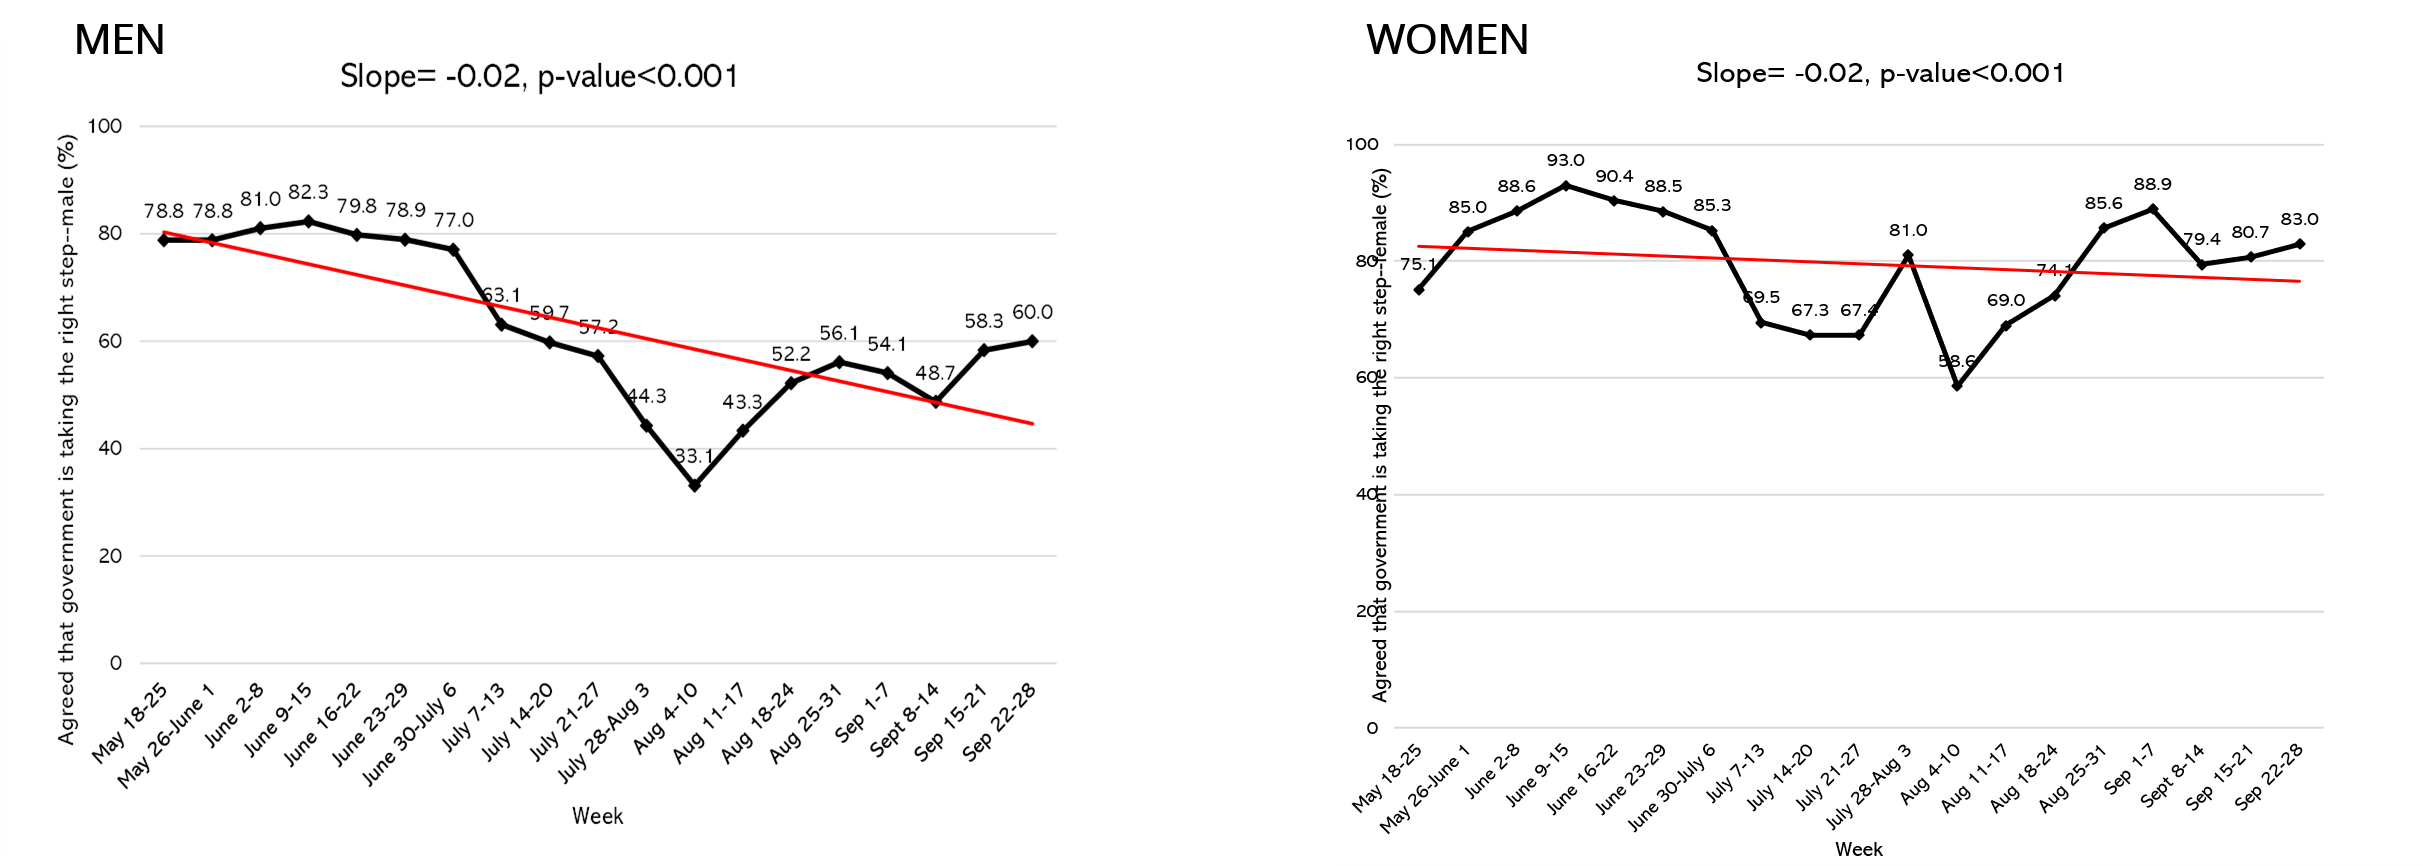
(back to previously reported results menu)
4. Vaccines
-see the Vaccine tab for most recent results
(back to previously reported results menu)
5. Mapping Risk
Net Behavioural Risk by Zones
Behavioural Risk Score by Saskatchewan Zones and Sub-Zones
Social Contours and COVID-19 Survey
Rounds 1-5, May 4 - September 30, 2020
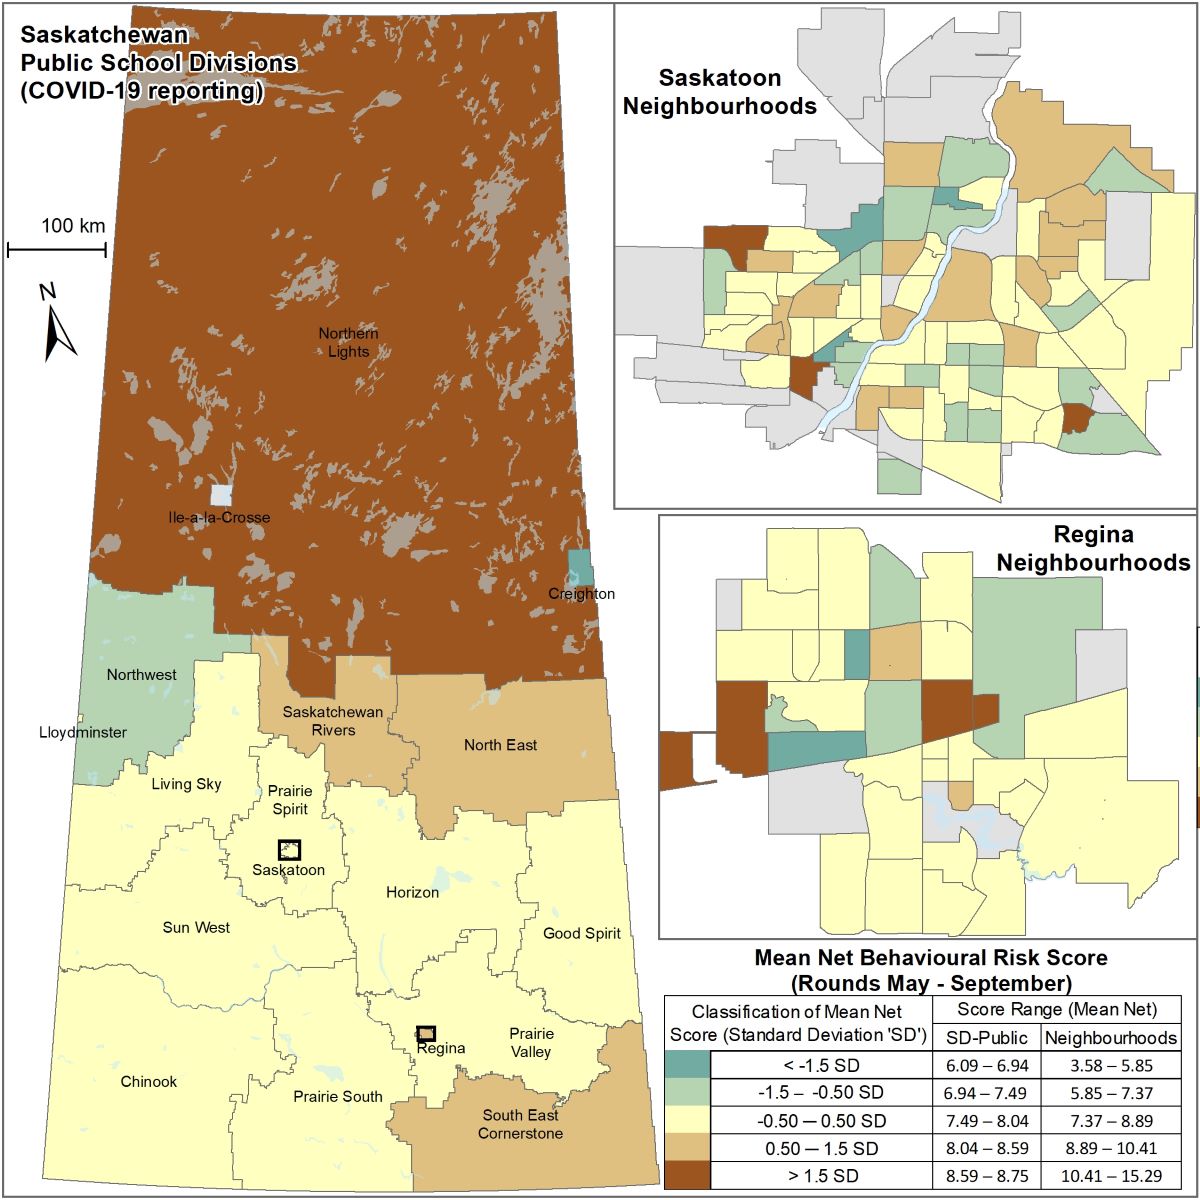
Behavioural Risk Score by Saskatchewan Public School Division Zones
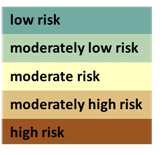
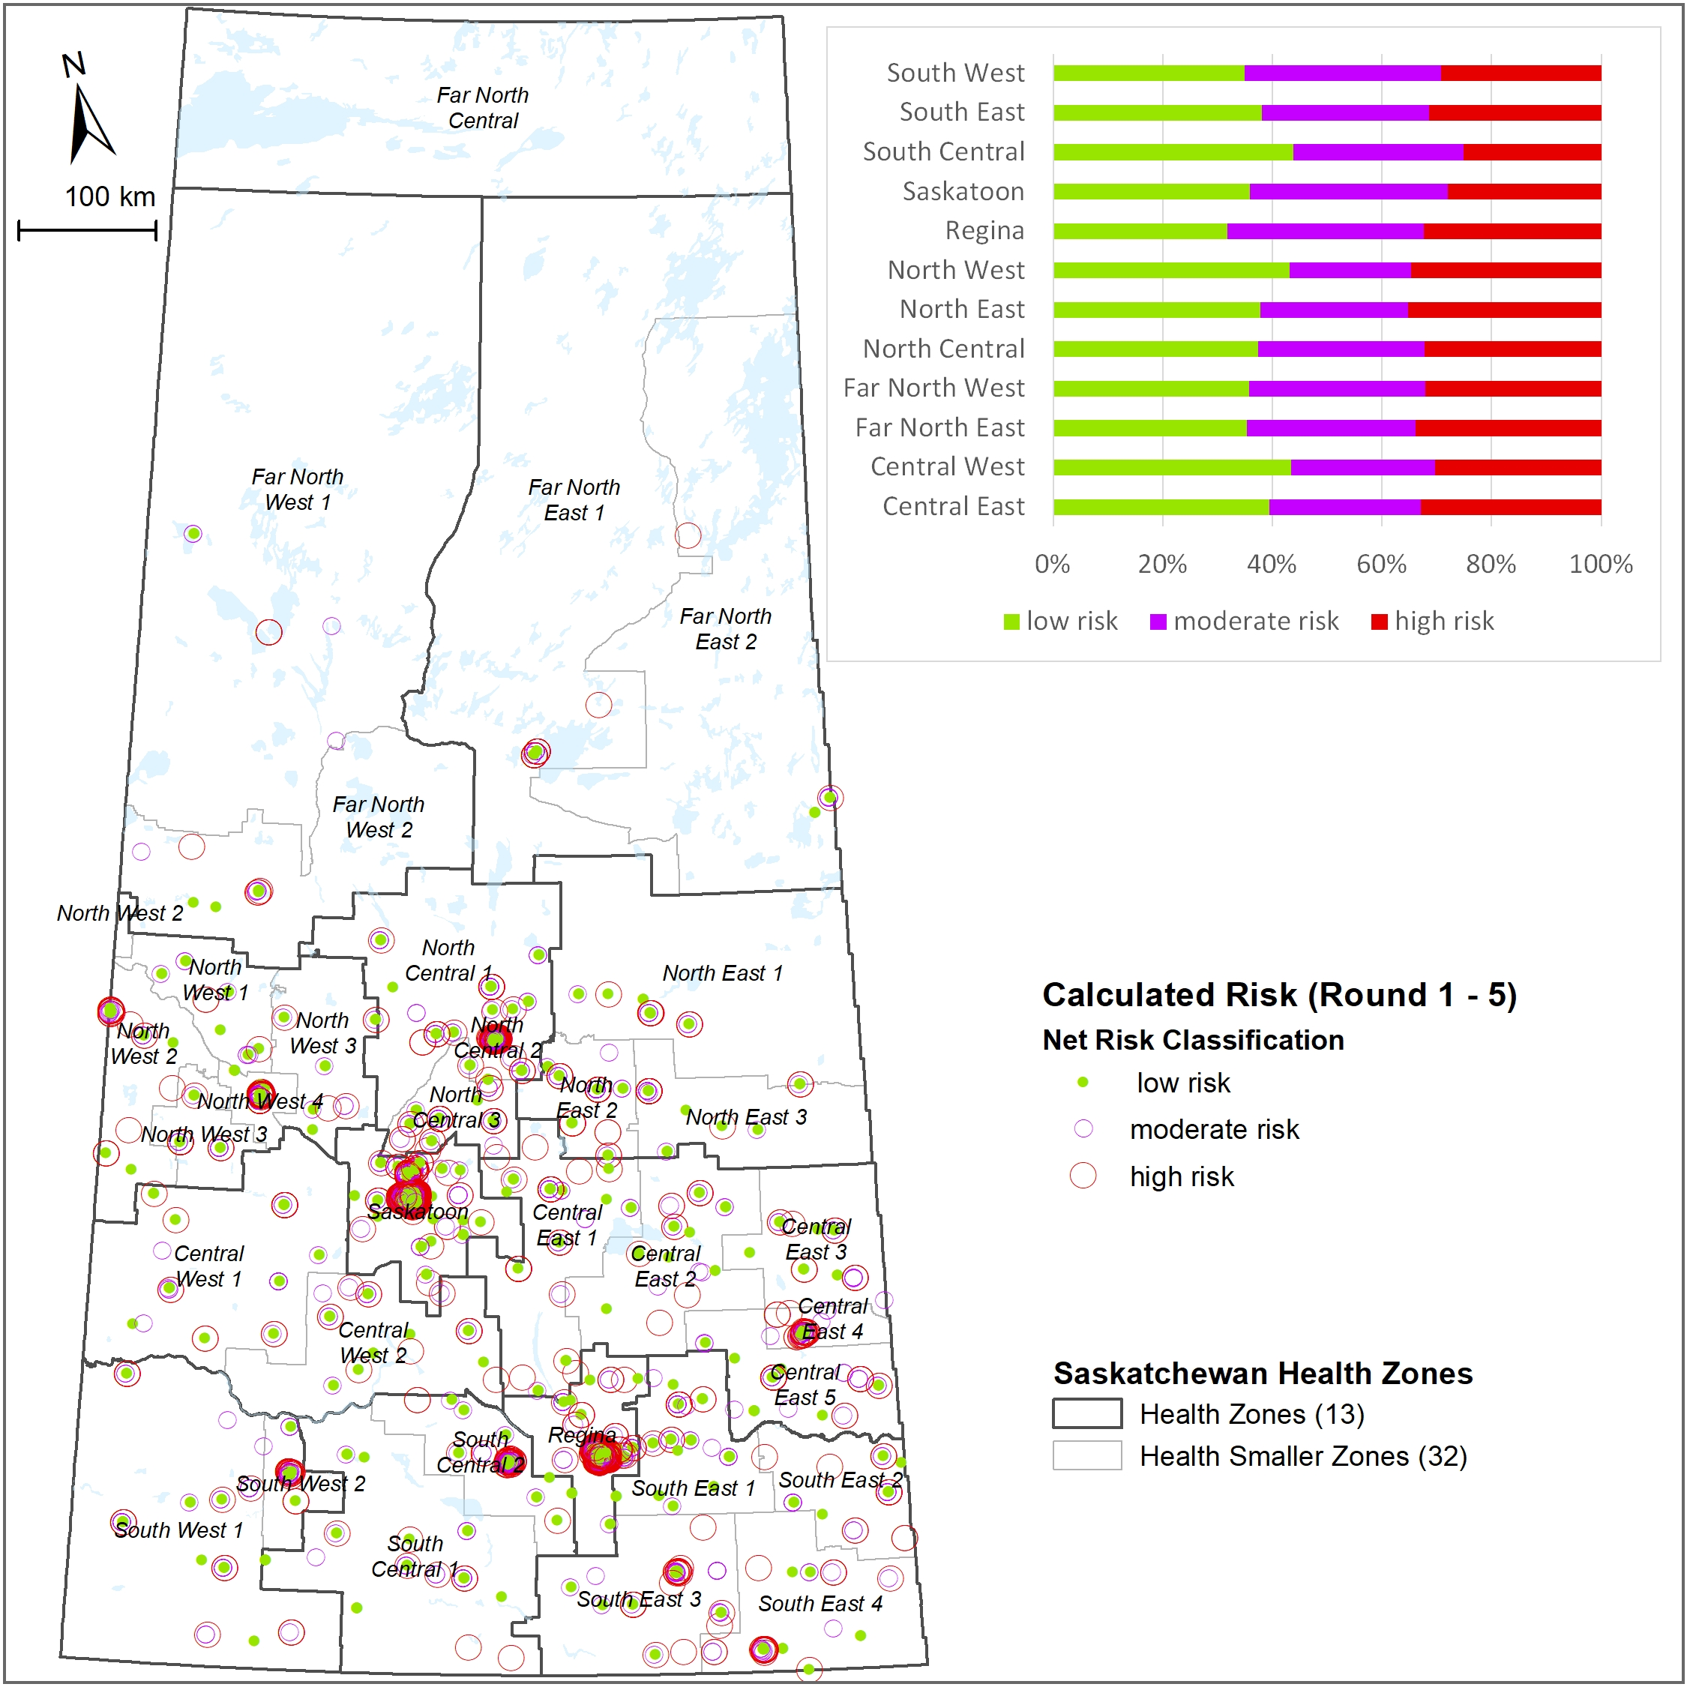
High, moderate, and low behavioural risk by location
Saskatchewan COVID-19 reporting zones
Rounds 1-5, May 4 - September 30, 2020
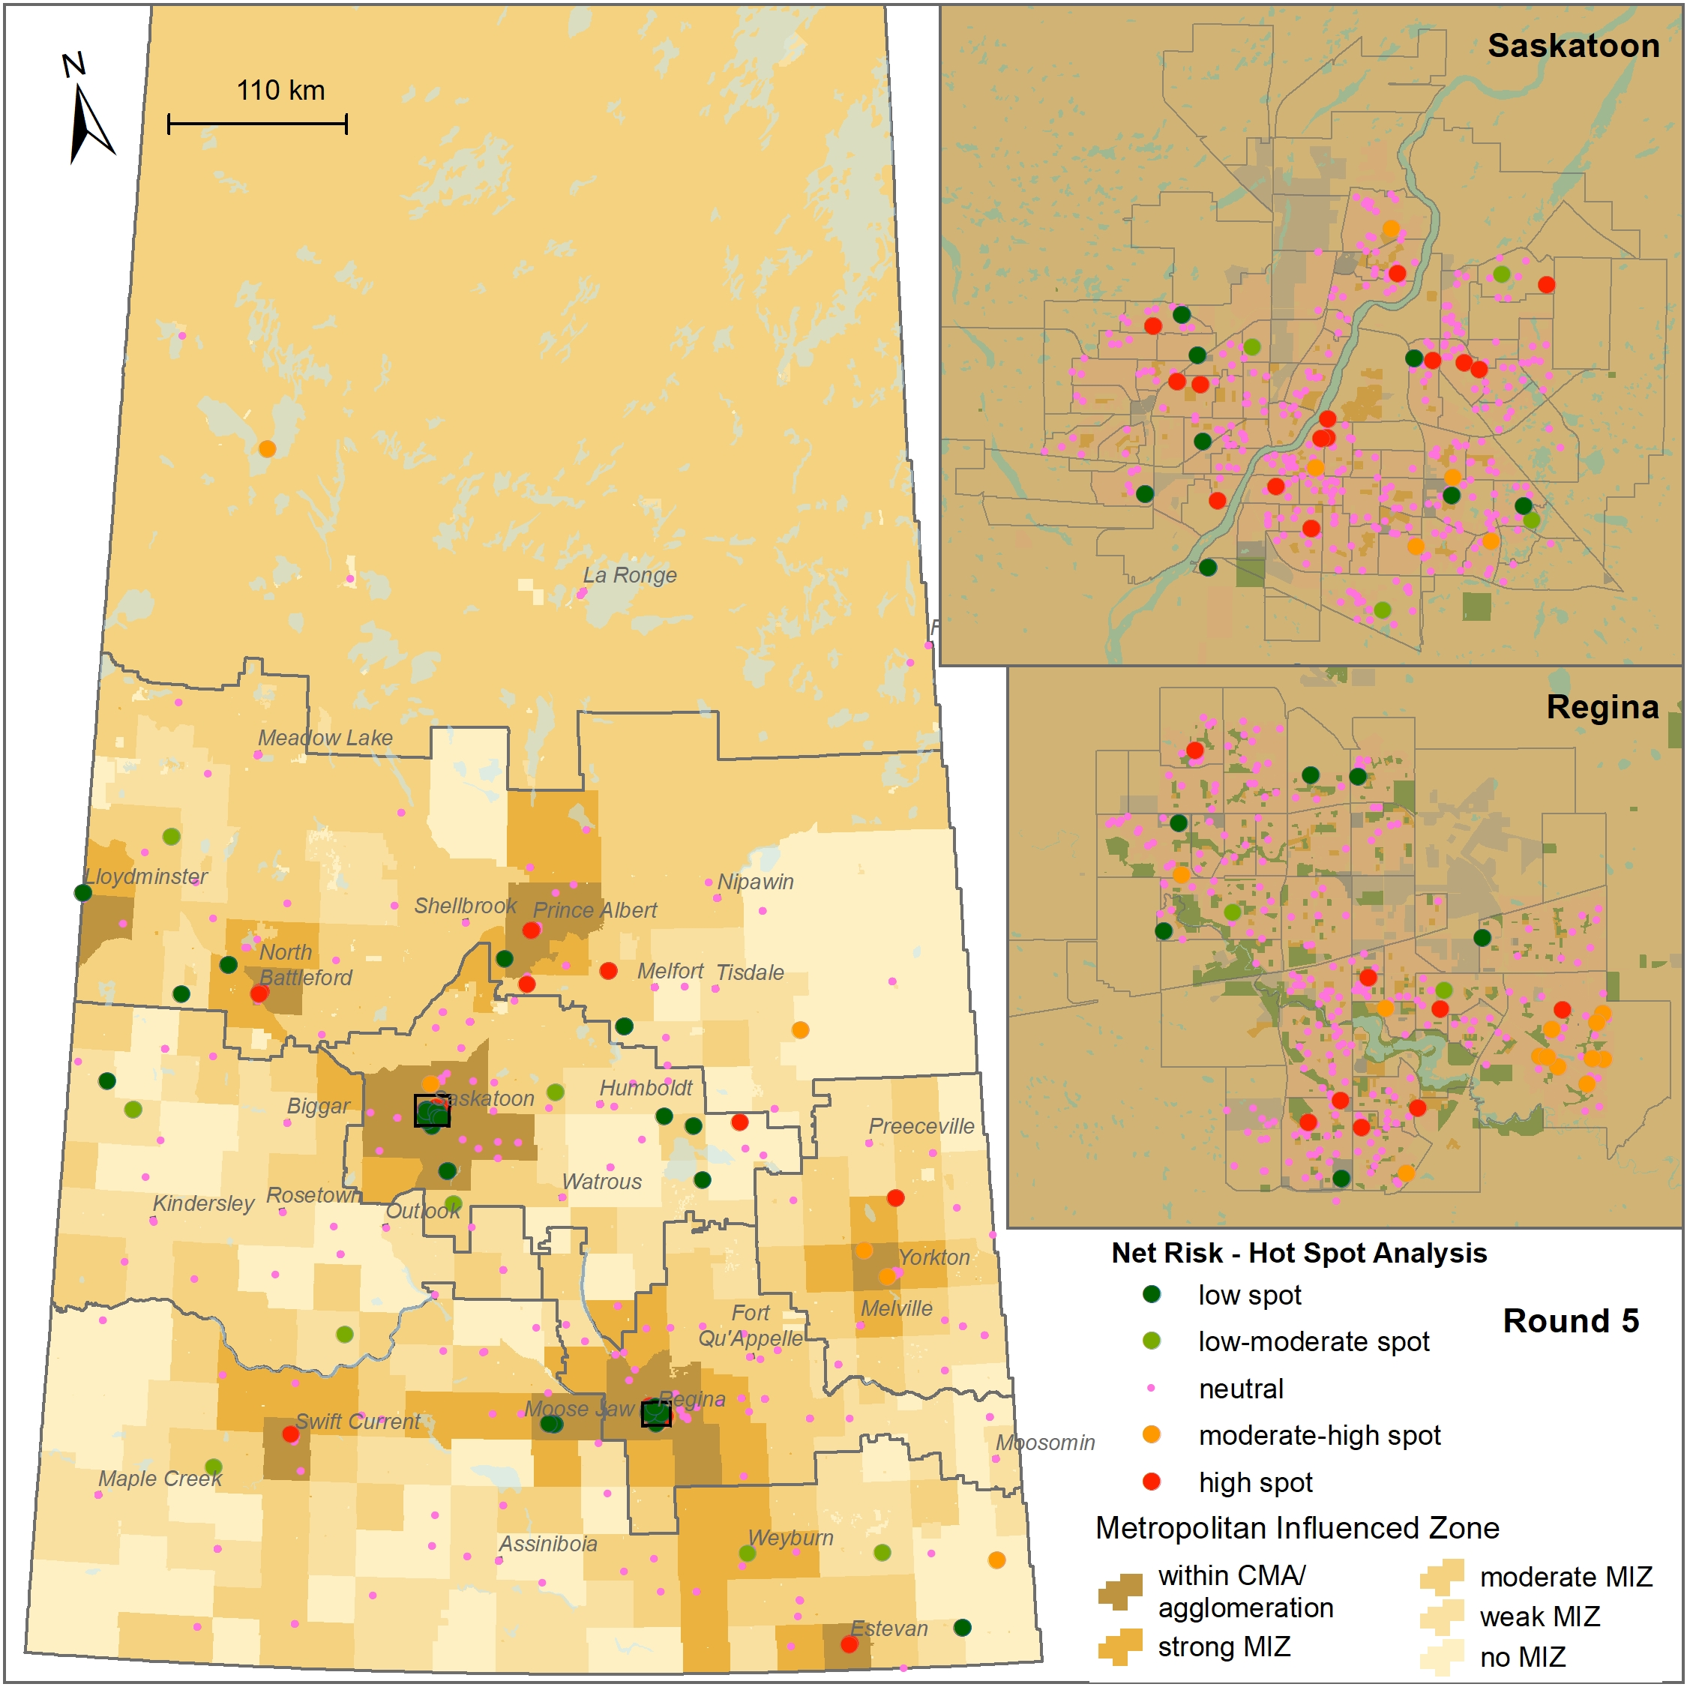
Behavioural risk hot spot analysis by location
Saskatchewan -September 2020 (Round 5)
(back to previously reported results menu)
6. Masks
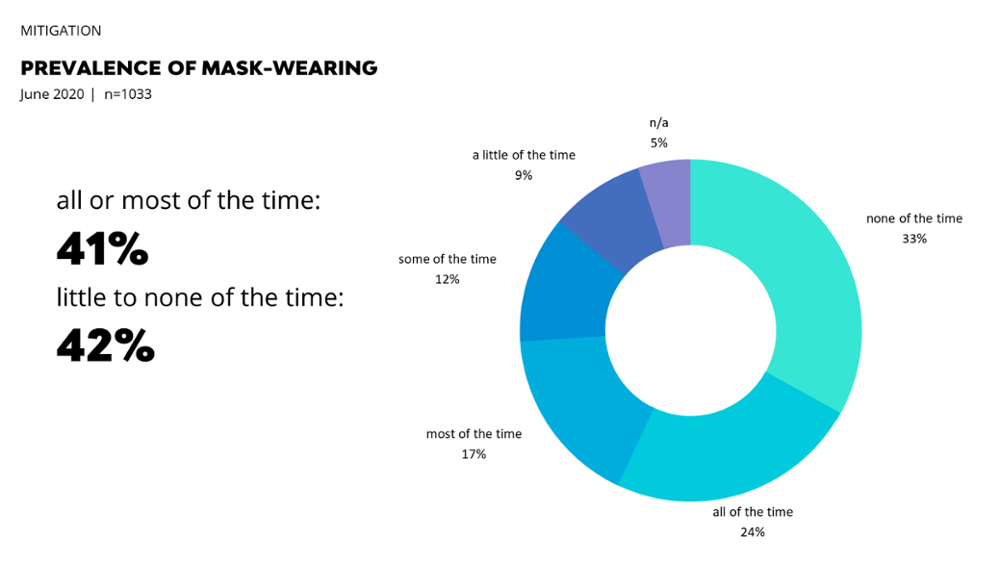
Behaviours (among mask wearers)
June 2020 | n=1033
- 91% maintain physical distancing all or most of the time (v. 70% didn’t wear)
- 98% always/most times wash their hands after being away from their home (v 85%)
- 89% always/most times try to avoid touching their face when out in public (v 74%)
Risk-Perception
June 2020 | n=1033
- 68% wore mask all/most time who said they will get "very sick" or die if infected (v 30%)
- 65% wore mask who said COVID-19 is a "very big threat" to the health of their community (v 14%)
- 49% wore mask among who were very concerned about spreading the virus to others (v 23%)
Mandatory Face Mask-Wearing
July 1-16 2020 | n=669
In the same Social contours and COVID-19 survey in Saskatchewan, we asked: “when should wearing a face mask be mandatory?” In July:
- 62%, a clear majority, said face masks should be mandatory inside a building at any time;
- 15% any outdoor public space; and
- 14% anytime when outside your property.
Only 11% responded that face masks should ‘never’ be mandatory. One in five (21%) indicated that they didn’t know or weren’t sure.
Those who indicated that mask wearing should be mandatory presented a similar profile to those who wore a mask frequently: older respondents, women, and those who perceived they would get very sick or die if they were to get the virus, were concerned about spreading to others, and felt COVID-19 was a big threat to their community.
- Older respondents (65 or older, at 93%), women (89%) more likely to respond masks should be mandatory when in public or inside a building (compared to ‘never’).
- Peoples’ perception of personal risk or spreading it to others or level of threat in the community is strongly correlated with likelihood to indicate mandatory mask wearing.
- Only 27% of those who said they will not get a vaccine if one were to available indicated mandating mask wearing, compared to 94% who said they will get a vaccine.
Masks: Saskatoon Sub-sample
Subsample Analysis, June (Round 2) and July (Round 3)
Posted Aug 26, 2020
Since the beginning of June, we have been asking Saskatchewan respondents to Social Contours and Covid-19 survey:
In the last 7 days, when you were inside a building (other than your home) where it was hard to maintain social distancing, how often did you wear a face mask?
The results below are based on the subsample of 1269 Saskatoon respondents in June (Round 2) and July (Round 3):
484 (38%) said they wore a mask all or most of the time when they couldn’t physically distance
- 103 (8%) said some of the time
- 259 (20%) little or none of the time
- 423 (33%) said they did not leave home or did not answer the question
For those whom this question was relevant (i.e. 846), 69% said they wore a mask all, most, or some of the time when they couldn’t physically distance inside a building. Those who are older (65+ years), women, and those with professional or advanced level education are more likely to indicate they wore masks all/most or some of the time.
Perception of personal risk was related to mask wearing among Saskatoon respondents. Those who said if they get COVID they will get very sick or die, are more likely to wear mask all/most/some of the time vs those who said they will not get very sick at all (77% vs 55%).
Saskatoon respondents concerned about spreading the virus to others or felt that COVID-19 was a “very big threat” to our community were more likely to wear mask:
- Those very concerned they would spread the virus to others were 2x as likely to wear masks frequently, compared to those who were slightly or hardly concerned (55% vs 46%).
- 88% of those who said COVID is a ‘very big’ threat to the health of their community wore masks frequently, versus only 27% who said that COVID is a “very small” threat—more than 3-fold difference.
We also found that those who wear masks frequently are more likely to also report other practices that are known to prevent the spread of the virus (i.e. risk mitigation):
- when out in public, almost all frequent mask wearers (80%) maintain physical distancing all or most of the time;
- most (74%) always wash their hands after being away from their home; and
- just over half (76%) always try to avoid touching their face when out in public.
Summary: Our timely survey shows that more than half of Saskatoon residents have adopted the new practice of wearing a face mask all or most of the time. Those concerned about spreading the virus to others and those who see the virus as a bigger threat to their community are frequent mask wearers. Mask wearing does not make people less concerned about other healthy practices; on the contrary, Saskatoon respondents who wear masks frequently are also very likely to follow public health recommendations regarding physical distancing, hand washing, and not touching their face.
_______
Nazeem Muhajarine and Social contours study team. Social contours and COVID-19: Using metrics and data to guide the reopening and reintegration process in Saskatchewan. Saskatchewan Population Health and Evaluation Research Unit (SPHERU). 20 August 2020.
(back to previously reported results menu)
7. School and Parenting
PERCEPTIONS: Parents/Caregivers of School-Aged Children
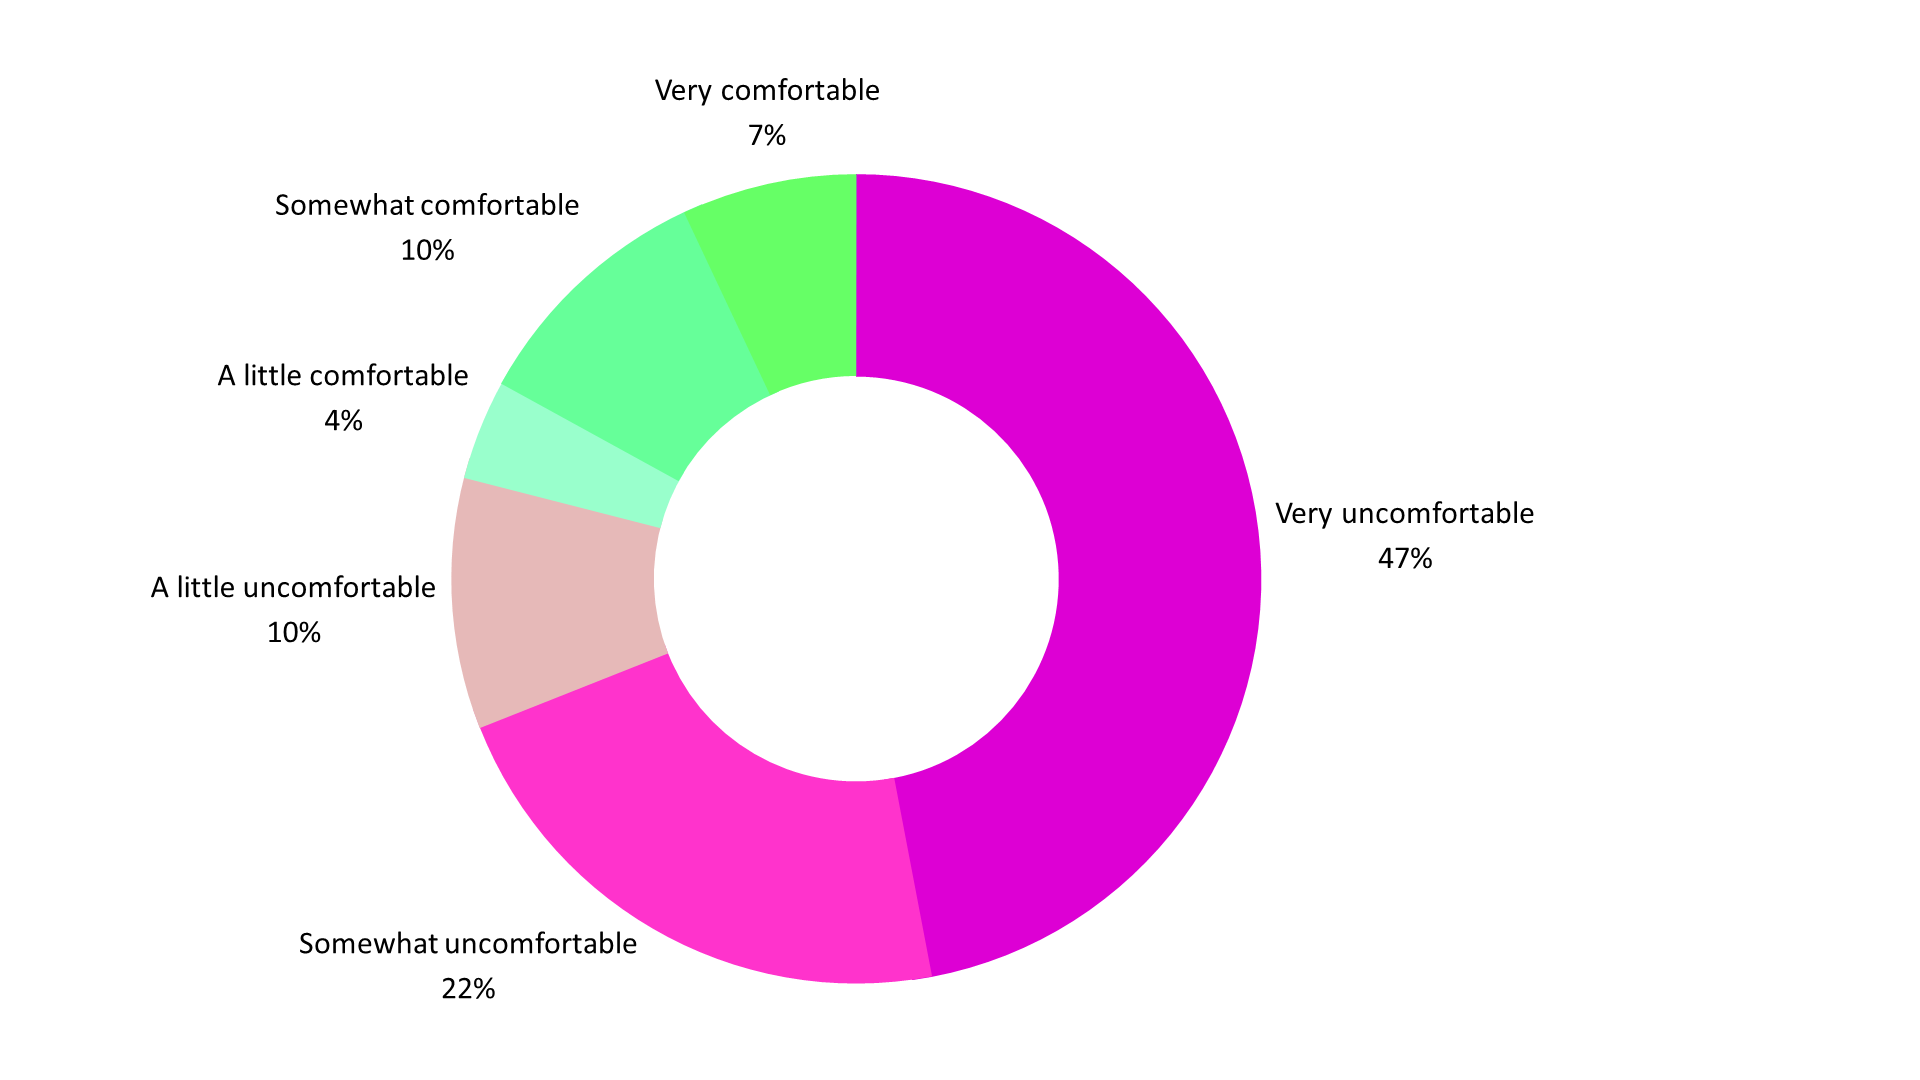
How comfortable are you with children returning to full-time, face-to-face classroom education in September?
July 16-Aug 21 (n=449); H30
As this chart shows, the majority of respondents, about 80%, indicated they were uncomfortable with children returning to school in September.
What is your current plan for schooling your children in September?
July 16-Aug 21 (n=357); H31
| Plan | n | % |
| Homeschooling/online schooling supervised by a parent | 69 | 19.3 |
| Homeschooling/online schooling supervised by another family member or caregiver | 8 | 2.2 |
| Sending to school because I have no other option | 190 | 53.2 |
| Sending to school because I believe it is safe | 90 | 25.2 |
Level of Comfort with children returning to classroom education by current plan for schooling in September
Crosstab: H31 and H31; Fisher’s Exact Test p-value<0.001
| Plan for Schooling | Uncomfortable (n) | Comfortable (n) | Total |
| Homeschooling/online schooling supervised by a parent | 66 | 3 | 69 |
| Homeschooling/online schooling supervised by another family member or caregiver | 8 | 0 | 8 |
| Sending to school because I have no other option | 173 | 17 | 190 |
| Sending to school because I believe it is safe | 21 | 69 | 90 |
| Total | 268 | 89 | 357 |
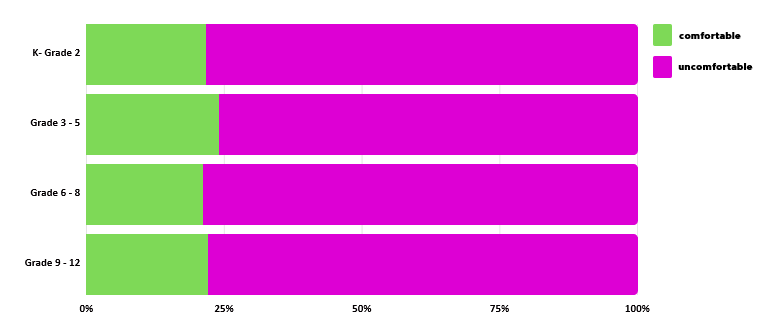
How comfortable are you with children returning to full-time, face-to-face classroom education in September?
by grade(s) of school-aged child(ren)
July 16-Aug 21 (n=449)
As this chart shows, across all grade levels, K to 12, the majority of respondents, three out of four, indicated they were uncomfortable with children returning to school in September.
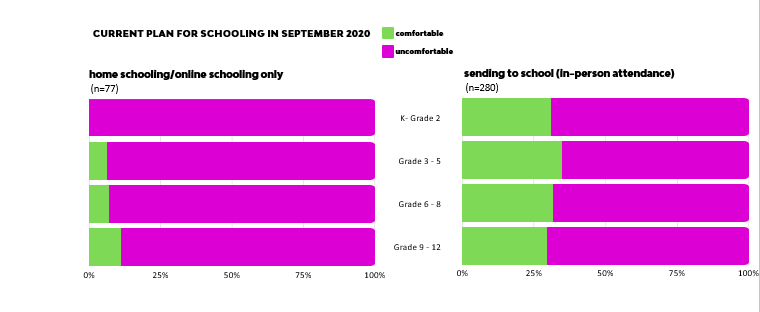
How comfortable are you with children returning to full-time, face-to-face classroom education in September?
by grade(s) of school-aged child(ren) - stratified by “current plan for schooling” their child(ren)
July 16-Aug 21 (n=449)
When we breakdown respondents’ comfort level and grades by current plan for schooling in September, a clear difference is seen: respondents who indicated they will be home/online schooling were clearly uncomfortable with their children returning to school; the younger the child, the more uncomfortable.
(back to previously reported results menu)
8. Results by Round
- prior to Round 4 (August), we posted montly results.
(back to previously reported results menu)